Europe’s Bull Market Hanging In The Balance
The post-2009 cyclical bull market in European equities is facing a critical test for survival – though, the writing may already be on the wall.
After last week’s Brexit bombshell, obviously all eyes are on Europe. It’s not that other markets, like the U.S., are not vulnerable. However, the current global contagion obviously began in Europe; therefore, the sooner the source can be contained, the better it will be for everyone. The question is, can the patient (Europe) make a recovery or is the situation terminal? In terms of the European equity bull market, we would not pull the plug just yet – but it is definitely on life support.
Now, readers may be asking, what bull market? With last week’s carnage, that is a legitimate question, especially considering the action in the PIIGS markets (e.g., Italy and Spain were down 12% on Friday and Portugal closed at a 20-year low!). Thus, one might be surprised to see the term “bull market” applied to Europe. However, if we look at a broad measure of stocks across the continent, e.g., the Dow Jones STOXX 600, we do find the post-2009 cyclical bull market intact…barely. At least, it’s intact if we use a basic trendline as the criteria.
Here is a weekly chart of the STOXX 600 since the 2009 low.
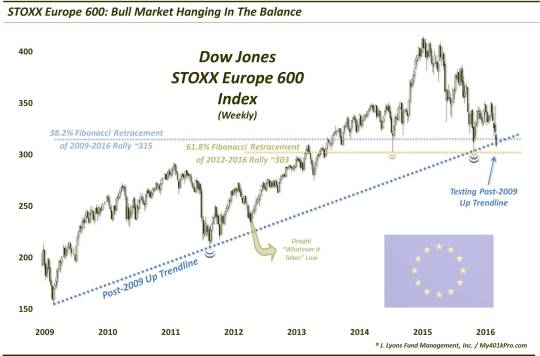
We like the STOXX 600 as a gauge of European equities as it conforms very well to technical charting analysis. And there are a couple of interesting things to note about its present circumstances.
First and foremost, the index is testing the Up trendline extending from the low in 2009 and connecting the lows in 2011 and this past February. Presently, the trendline (on a linear scale) is in the vicinity of 310. The STOXX 600 closed today at 308.75. So, allowing for a little leeway in drawing the trendline, the index is squarely testing the trendline at the very moment. We will note that the chart is a weekly candlestick chart. Therefore, the index could theoretically drop below the trendline during the week, yet close above it on Friday for an arguable “hold”. However, given the fact that the previous touches in 2011 and February were both weekly “lows” as opposed to closes, even an intraweek break would be a change of character.
Secondly, note the significant Fibonacci Retracement levels in the vicinity of current prices. Again, Fibonacci refers to a mathematical sequence that, in this case, often contains retracements of rallies from significant lows to subsequent highs. In this case, the significant lows are the 2009 low and the 2012 low. The 2012 low coincided with Mario Draghi’s “Whatever it takes” proclamation pertaining to the ECB’s pledged support to the markets and economy. While the 2009 low is essentially ubiquitous in its significance around the globe, we have found the 2012 low to be especially pertinent to the movement of European markets.
Specifically, the 38.2% Fibonacci Retracement (the 2nd most important % of the sequence) of the 2009-2015 rally sits near the 315 level, which marked last Friday’s low. The close confluence of this level with that of the trendline obviously makes this area key. Additionally, the 61.8% Fibonacci Retracement
(the most important)
of the 2012-2015 rally lies just below, near the 302.50 level. This area incidentally marked the October 2014 and February 2016 lows, on an intra-week basis. Thus, should the index fail to hold the trendline, it is important that it holds the 302-ish area. Although, again, even a hold there may involve some further technical deterioration if the index closes this week below the 3-year weekly low close from February of 312.41.
Speaking of technical deterioration, we noted in the intro that the bull market may be doomed, even if it is able to hold these technical levels for now. Why do we say that? Simply by looking at the proximity of peaks and troughs. Even if one takes the stance that the pullback since the 2015 highs is a minor wave, and thus the lower highs since then are not consequential in the longer-term – we still run into a problem with the troughs. Assuming the STOXX 600 is making higher highs, in the longer, cyclical-term, the lows in October 2014 and February 2016 are horizontal. Thus, the failure to make a higher low in February already indicates a breakdown, or at least the precursor to a breakdown, in the post-2009 bull market trend. Especially if prices test that 302 level again, and even hold temporarily, it may just be delaying the inevitable. Plus, it would trace out another potential bearish head-and-shoulders pattern, post 2013.
And why do we say another head-and-shoulders? If we scroll out to view the history of the STOXX 600, one can see why – and can also see why this 300-ish level is important on a historical level as well.
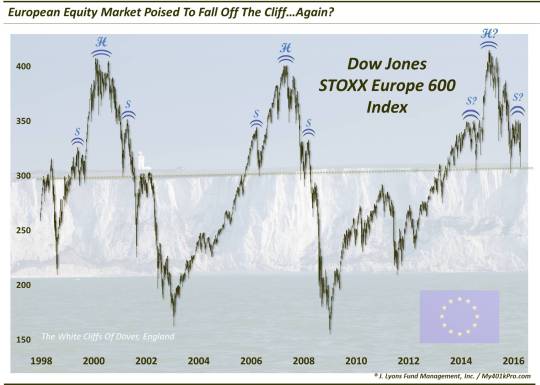
From this long-term perspective, the STOXX 600 has enough compelling aspects to make a chartist salivate (it looks like an EKG for heaven’s sake). First of all, while “triple tops” are few and far between on a short-term scale, this potential decades-long version is pretty much staring us in the face. If it is not a triple top, the 25% drawdown since the 2015 top is a pretty good head-fake.
Furthermore, as we mentioned, the index’s history with head-and-shoulders patterns sticks out like a sore thumb. The symmetry of the prior two, which saw their peaks (i.e., heads) in 2000 and 2007 is unmistakable. The necklines of each sat near the same 300 level presently in play. One look at the similarity of the current potential head-and-shoulders pattern is enough to give even the most TA-atheistic observer some technical analysis religion.
By the way, the imagery of the White Cliffs of Dover, England is intentional. For the considerable support near present levels may well hold, temporarily. However, if prices do break the neckline and prior lows around 300, the STOXX 600 might once again fall off the proverbial cliff.
________
More from Dana Lyons, JLFMI and My401kPro.
The commentary included in this blog is provided for informational purposes only. It does not constitute a recommendation to invest in any specific investment product or service. Proper due diligence should be performed before investing in any investment vehicle. There is a risk of loss involved in all investments.