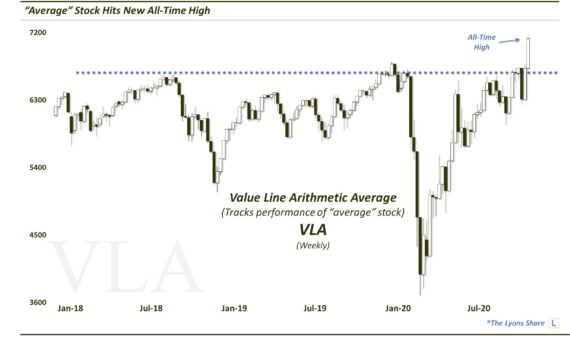
Can Broker Stocks Finally Get Past The “2-Step”?

One of the few sectors that has shown little inclination to participate in the equity rally – broker-dealers – has an opportunity to gain some traction here.
One thing that has been a boon of late for the post-February rally has been the new leadership stepping forward among the sectors. While the idea of “rotation” is an overused notion, in our opinion, it genuinely fits our recent circumstances. While the defensive leaders of the first half have taken a breather, for example, more growth and cyclical type areas have stepped in their place. Along the way, the major averages have not skipped a beat. One area that has been conspicuously absent among this leadership rotation, however, has been financials – and specifically, broker-dealers.
Throughout the steady climb in the indices, one thing that has been consistent and predictable has been the straggling of the financial sector. It’s not that the stocks haven’t advanced; it’s that they have been unable to sustain enough momentum to even break their downtrend stemming back to their highs of more than a year ago. It’s basically been 2 steps forward and 1 step back.
From a fundamental standpoint, the “lower for longer” trend in interest rates has obviously not helped the group as it eats into their potential margins. To be honest though, that type of qualitative analysis is something that we try to avoid. Instead, we use prices and charting analysis as a guidepost in determining just how much low rates – or anything else, for that matter – may be hurting the sector. Thus, when we say that the struggles of the sector have been “predictable”, it’s not that we “know” what the Fed is going to do or not do. That is unknowable. But we can identify spots on the chart that “should” serve as resistance, or hurdles, for stock prices.
One such charting technique that has been helpful in locating points of potential struggles in the financial sector has been a simple trendline. In this case, the Down trendline from the summer 2015 highs has been able to hold the financial rallies in check with consistency since the February lows, as evidenced by some of our posts along the way:
May 18:
Asset Management Companies Should Dump Their Own Stock
May 21:
Rate Hike? This Chart Says Don’t ‘Bank’ On It
Just in the past few weeks, however, some of the charts in the financial sector have finally begun to look more constructive. This includes the banks which finally broke their post-2015 Down trendline, as we pointed out on August 8. Broker-dealers and asset managers have, as yet, failed to do likewise, however. They presently have the opportunity to do so, though, as the following charts illustrate.
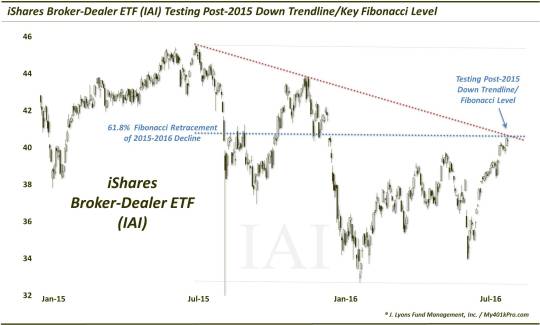
First, here is the iShares Broker-Dealer ETF, (ticker, IAI) bumping against both the post-2015 Down trendline and the 61.8% Fibonacci Retracement of the 2015-2016 decline.
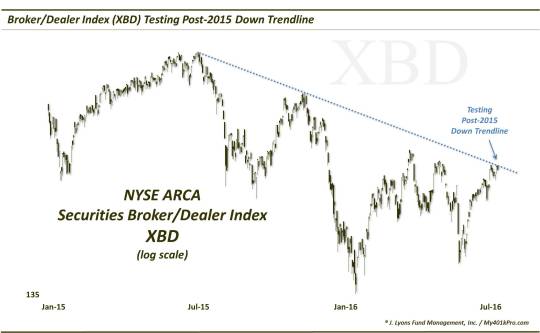
Similarly, the XBD, or the NYSE Broker-Dealer Index, is also testing its post-2015 Down trendline, on a log scale.
And likewise, the Dow Jones U.S. Asset Managers Index is testing the same trendline.
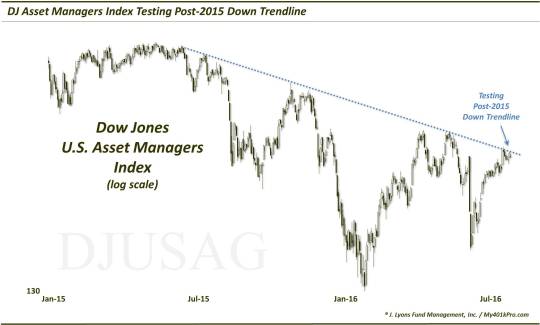
If these series are successful in surmounting the aforementioned trendlines, it could open up meaningful potential upside in the sector.
What that would imply about interest rates, we could speculate. However, we wouldn’t need to as we’re better off just watching those prices as well. But for broker-dealers, if they can break above the trendlines – and stay there – the
space may finally be able to sustain some upside momentum instead of the 2 steps forward, 1 step back routine.
_________
More from Dana Lyons, JLFMI and My401kPro.
The commentary included in this blog is provided for informational purposes only. It does not constitute a recommendation to invest in any specific investment product or service. Proper due diligence should be performed before investing in any investment vehicle. There is a risk of loss involved in all investments.