Here Comes The Rising Rate Ruckus Again
Short-term rates are testing their near-term and looong-term downtrends.
“Test Week” concludes with a look at the interest rates. In late July, we noted the opportunity that rates had, at least on the short end, in potentially establishing some upward momentum finally. In recent years, we have on several occasions made light of the ubiquitous calls for higher interest rates. It’s not that we are smarter than everyone else. It’s just that we recognized the reality that – rates were, in fact, NOT going up. And as another matter of fact, they have actually been going down for the past 35 years.
However, very recently we’ve been noting the opportunity for rate rises to finally materialize. In July, we looked at the 2-year treasury rate which, after breaking a 2-year Up trendline in the wake of Brexit, was testing the breakdown point. We surmised that if the 2-year yield was able to reclaim the trendline, it would confirm a false breakdown and potentially gain traction to the upside. A possible catalyst was a hot reading in the 2nd quarter GDP report to be released that day. As it turned out, the number was much weaker than expected and, thus, (surprise!) no interest rate breakout.
Well, the way rising rate scares work is – just wait another month. And here it is in late August, right on cue. Following comments from the Fed Vice Chairman, interest rates spiked higher on the day. Looking again at the 2-year yield, at 0.84%, it is back to another interesting spot. In the short-term, the 2-year yield is now back above the aforementioned two year-long Up trendline that it broke post-Brexit. It is also testing the Down trendline that has been in place since December of last year.
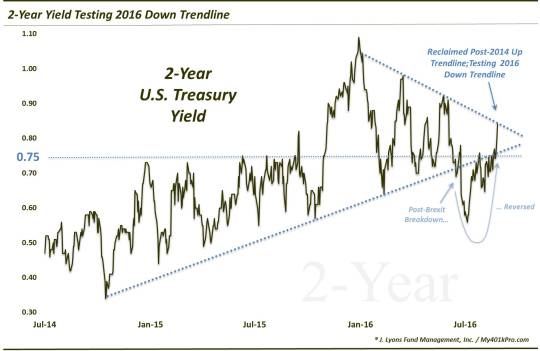
Should yields break out above that Down trendline, rates could see further, possibly considerable upside (yes, I know we have heard that before).
Speaking of trendlines, the longer-term, is even more interesting. 2-year treasury yields peaked back in 1981 at 17% (yes, 17%!). Well, if you draw a trendline from that 1981 peak, connecting the 2007 peak, it would currently intersect at…0.85% (on a log scale, the trendline is more defined and presently intersects around the 3.5% level – that will be the line to watch, if and when it ever gets there).
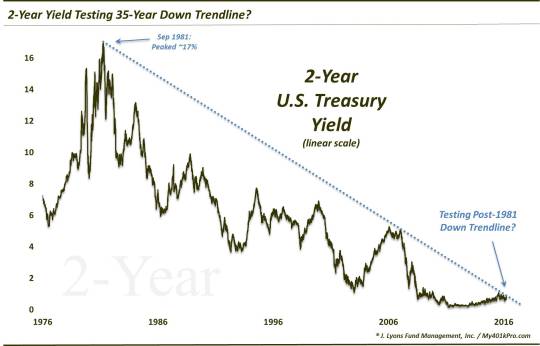
Now some folks would take exception to this trendline as it contains just 2 connecting points. That is a valid point – we would prefer at least 3 connections for a robust trend. However, if you look closely, the 35-year trendline has actually traced along the post-2015 peaks shown above in the first chart. Thus, there are arguably more connections than just the 2.
Therefore, considering the length of the trendline, the proximity to current levels and the fact that yields have been treading just below it for the past 8 months, it makes for a compelling story. Imagine if this trendline is broken. If it is indeed valid, we could actually see some veritable semblance of “rising rates” come to fruition.
_____________
More from Dana Lyons, JLFMI and My401kPro.
The commentary included in this blog is provided for informational purposes only. It does not constitute a recommendation to invest in any specific investment product or service. Proper due diligence should be performed before investing in any investment vehicle. There is a risk of loss involved in all investments.