Rising Rates (Really) Reaching Resistance?

The spike in the 10-Year Yield has brought it into a cluster of significant potential resistance stemming back nearly a decade.
Today’s Chart Of The Day continues our recent run of technical looks at specific price charts, particularly those nearing potential junctures of significance. The past few days it was metals in silver and steel. Today, it is a big one: the 10-Year U.S. Treasury Yield (TNX). The recent spike in yields have spawned a new “rising rates” chorus from among the investment community. Back in June, we suggested that the long-awaited turn higher in yields was perhaps finally a possibility, if only because so many had finally given up on its inevitability. However, even if the long-term cycle is finally turning higher (A LOT more evidence is needed to determine that), the rise will not be a straight line, the past 2 weeks notwithstanding. And the TNX may now be approaching a point of resistance.
Just prior to the election, we suggested that the 30-Year Yield (TYX) might see its rally struggle around the 2.65% level that it was hitting at the time. Well, needless to say the reaction to the election, er, trumped whatever potential chart resistance existed at the time as the TYX rocketed higher. Similarly, the TNX shot higher at a near-record pace and has found itself as high as 2.35% in recent days. That leaves it squarely testing a cluster of potential points of resistance between 2.30%-2.40%
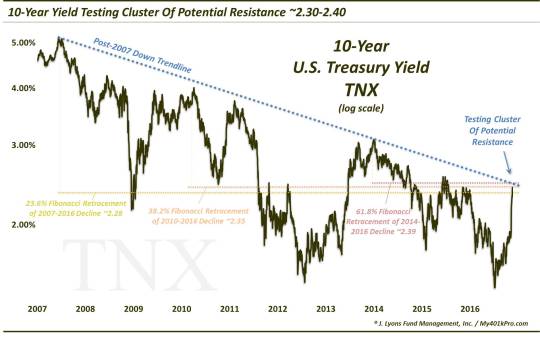
Included in this cluster of potential resistance are the following:
- 23.6% Fibonacci Retracement of 2007-2016 Decline ~2.28%
- 38.2% Fibonacci Retracement of 2010-2016 Decline ~2.33%
- 61.8% Fibonacci Retracement of 2014-2016 Decline ~2.39%
- The Post-2007 Down Trendline (on a log scale), connecting the 2014 High ~2.37%
All this adds up to possible stiff resistance to the immediate rise in 10-Year Yields. At least it should be much stiffer than the level mentioned in the post on the TYX a few weeks ago. It is certainly the most critical upside test since the late 2013-early 2014 test of the 3.00% level. The post-2007 Down trendline is the most consequential trendline before challenging the post-1987 and, ultimately, the post-1981 trendlines. And as we have said many times, the confluence of Fibonacci Retracements in the same vicinity not only adds layers of potential resistance, it goes a long way toward validating the junctures identified as significant.
If indeed the long-awaited start of a new secular upturn in yields is at hand, this level obviously will not hold permanently. However, it does appear to be compelling enough resistance to at least temporarily halt the recent rise in rates…really.
_____________
More from Dana Lyons, JLFMI and My401kPro.
The commentary included in this blog is provided for informational purposes only. It does not constitute a recommendation to invest in any specific investment product or service. Proper due diligence should be performed before investing in any investment vehicle. There is a risk of loss involved in all investments.