Will Breadth Thrust Launch Stocks Higher — Or Burn Out?

Large, broad stock market rallies like last week’s can either kick-start a major up-move or signify an exhaustive end to a rally.
We’ve talked about the notion of “breadth thrusts” on several occasions. Basically, the term describes the development in which the stock market displays an inordinate level of positive breadth over the course of several days to several weeks. Such events have typically originated from a deeply oversold condition in the market and have often (though, not always) marked the springboard for substantial intermediate-term rallies. While they can can be measured any number of ways, we track a unique form of breadth thrust via a statistic that measures the average daily percentage price move of all stocks on a particular exchange. For decades, this particular statistic (known as QCHA) has been supplied by an organization named Quotron, and distributed in Barron’s each week.
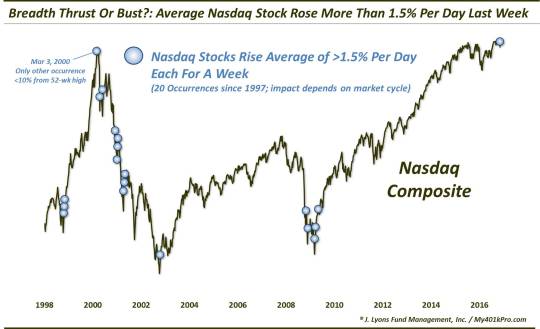
Quotron’s version of the statistic for Nasdaq stocks, called “QCHAQ”, did something rare last week. The average QCHA from Monday through Friday was 1.5%. That means that stocks on the Nasdaq rose an average of more than 1.5% per day each last week. As our Chart Of The Day points out, this was just the 20th time in the last 19 years that this occurred.
We’ve mentioned this statistic previously a few times, including in October 2015 as it pertained to the NYSE. As we indicated in that post, the stock market has reacted in an almost binary fashion following these signals. And the delineating factor seems to merely be the prevailing cyclical market environment. From October 2015:
So of the 17 prior weeks that saw the average NYSE stock climb at least 1% per day for a week, 12 marked a traditional breadth thrust that provided a springboard for significant further intermediate-term gains. The other 5 marked the opposite: an immediate collapse in prices.
So what is the deal here? We’ll go back to what we wrote on Thursday regarding the all-or-nothing VIX signals. The delineating factor separating the two binary outcomes is the cyclical market environment that exists at the time of the signal. During cyclical (i.e., measured in years) bull markets, these breadth thrusts signify the end of market weakness and the beginning of a frenzied return to a “risk-on” environment. That is, a springboard to a rally.
During a cyclical bear market, a breadth thrust may be a sharp bounce in stocks that merely leaves the market in an overbought status at resistance. If there is no “risk-on” frenzy to build upon the breadth thrust and carry stocks further, they become vulnerable to the next leg lower within the bear market.
The same appears true of the Nasdaq version shown here in the chart. Some of the signals, including those occurring just off of bottoms in 1998, 2002 and 2009 were able to launch the Nasdaq onto major rallies. On the other hand, during the cyclical bear markets in 2000-2002 and 2008-2009, these signals flamed out in short order, resulting in immediate reversals that gave back all of the breadth thrust gains, and then some.
Check out the dates of the signals (loosely separated by signal effectiveness), and the Nasdaq’s subsequent performance.
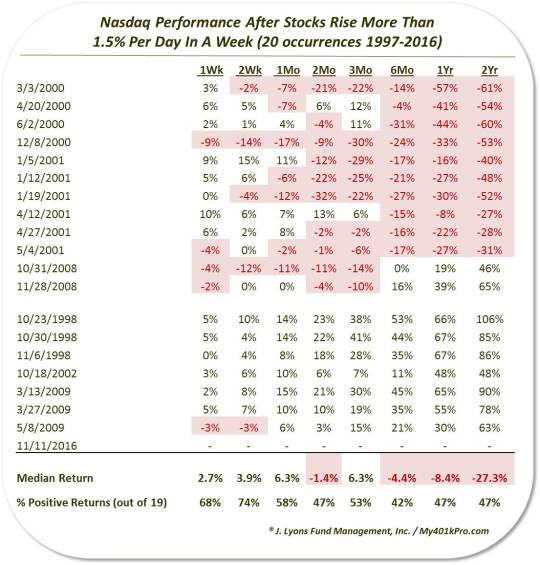
As one can see, it was essentially all or nothing – not much middle ground. Therefore, the median results are a bit misleading. While they ping-pong back and forth between positive and negative over the various time frames, the number of positive and negative returns are always within a few occurrences of each other.
As an example of the all-or-nothing results, of the 8 signals that “worked” over the following 6 months, all of them were up double digits, at an average of +32%. Of the 10 that did not work, all but one was down at least -14% (one was unchanged). Over the following year, each of the 9 winners was up at least +19%, averaging over +50%. All but 1 of the 10 losers was down at least -19%, and at an average loss of -30%. The 9 2-year winners were each up at least +46% and at an average gain of +72%. The 10 losers were each down at least 28% and at an average of -45%. You get the picture. These types of all-or-nothing signals are dangerous – and we’ve seen quite a few of them over the past week. Get the signal wrong and not only do you not make money, but you stand to lose a great deal.
Another potential risk here is that these are not traditional breadth thrust conditions. While the Nasdaq did pull back modestly in recent months, most signals took place following extensive market damage. Case in point: the previous 19 signals took place when the Nasdaq was an average of 40% below its 52-week high. Just one other occurred from within 10% of the 52-week high like our present case. Ominously, that was in March 2000 which, of course, marked the precise top of the Nasdaq bubble.
Which way will last week’s breadth thrust take us? A case certainly could be made either way. At this point, the bulls appear to warrant the benefit of the doubt. However, careful monitoring needs to employed, as always. Because if the recent signal fails to launch stocks higher, the market could very well go down in flames.
________
“Rocket Chimp” photo by Chetham’s Library.
More from Dana Lyons, JLFMI and My401kPro.
The commentary included in this blog is provided for informational purposes only. It does not constitute a recommendation to invest in any specific investment product or service. Proper due diligence should be performed before investing in any investment vehicle. There is a risk of loss involved in all investments.