Will Headwinds Put A Roof On Copper Rally?

Copper prices have been red-hot, but the rally may encounter some challenges here.
Of the myriad of markets to scream higher in the week since the presidential election, one of the more high profile rallies has been that of copper. In fact, like most of the industrial metal complex, copper actually started moving a couple weeks prior to the election. So, as happens so often, the industrial metals (i.e., those folks buying them) seemed to discount the improbable election of Donald Trump well ahead of time.
Then again, perhaps the rally had nothing to do with the election. Either way, it does not matter to us. All that matters is what is happening. And what is happening right now is a potentially stiff challenge to the immediate continuation of the copper rally. We make this suggestion for a couple reasons.
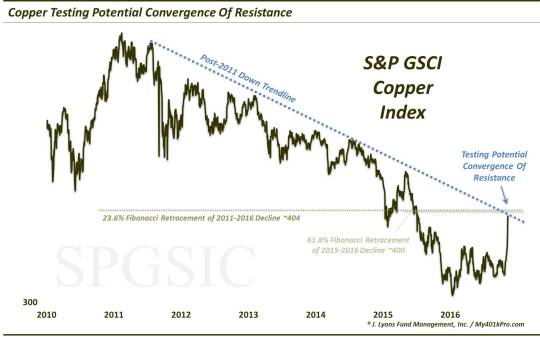
First of all, there is price. Using the S&P GSCI Cooper Index (currently at 394), the price of copper is presently testing the following potential resistance levels:
- Post-2011 Down Trendline (on a log scale) ~397
- 23.6% Fibonacci Retracement of 2011-2016 Decline ~404
- 61.8% Fibonacci Retracement of Decline from Dec 2014 Breakdown Pt/May 2015 Peak to Jan 2016 Low ~400

Interestingly, the past 3 days saw the Copper Index break above these resistance levels – Friday, by 7.5% – before closing back at or below them. Thus, this area has seemingly been validated now as legitimate resistance.
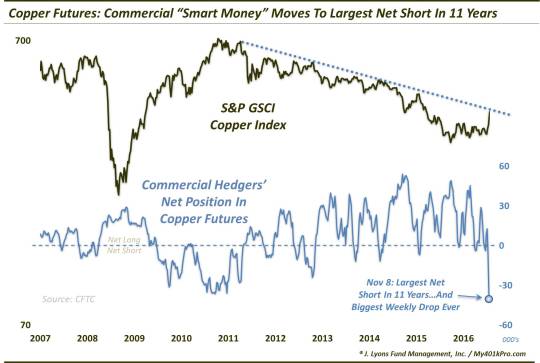
It’s not only price, however. Looking at trader positioning in copper futures, we see another potential reason for concern. That’s because this past week saw Commercial Hedgers increase their net short position by over 31,000 contracts, the largest increase on record, going back to 1989. Furthermore, their current net short position of roughly 38,000 is their largest net short position since 2005.

Why is this significant? Commercial Hedgers are deemed the “smart money”. Again, this is not because they are always right. They take positions opposite trend-following Speculators, e.g., commodity funds, hedge funds, etc. Thus, during long trends, they can be wrong for some time. However, at important junctures and turning points, they are almost always correctly positioned. That’s one of the benefits of tracking this data published in the CFTC’s Commitment Of Traders report.
And given the Hedgers’ largest net short position in 11 years, it could be a considerable headwind, especially if copper prices begin to sell off. Now, if prices break right through the aforementioned resistance, the unwind in futures positions will not yet be triggered. Thus, the Hedgers’ net short will perhaps continue to get more and more extreme.
The current set of circumstances do warrant caution in this red-hot commodity, however, in our view. And as an FYI, we have posted 2 similar setups in recent weeks involving natural gas and coffee. Nat gas prices greeted our post by dropping more than 25% in the past few weeks. And coffee too has started to come in a bit after our post from a week ago.
So while copper prices have gone through the roof in recent weeks, recent evidence from similar setups across the commodity space would seem to suggest a bit of caution here.
________
More from Dana Lyons, JLFMI and My401kPro.
The commentary included in this blog is provided for informational purposes only. It does not constitute a recommendation to invest in any specific investment product or service. Proper due diligence should be performed before investing in any investment vehicle. There is a risk of loss involved in all investments.

