Will Heavy Resistance Test Mettle Of Steel Stock Rally?

A popular steel ETF is testing a perfect storm of chart resistance.
As we let the dust settle on some of the post-election market madness, we are focusing some of our ChOTD’s (Charts Of The Day) on the technical picture of some specific tickers and indices. Today, we look at a major benefactor of the presidential election, at least based upon its performance in the lead up and aftermath to the election: steel stocks. Specifically, we are looking at the chart of the VanEck Vectors Steel ETF, ticker, SLX. The SLX has certainly been on a great run, rising 140% since its January low, 40% since its September low and 9% just since the election. That said, it is now hitting a multitude of potentially key resistance levels.
In fact, there are at least 5 noteworthy pieces of technical resistance in the vicinity of current prices (closed today at 37.73). For starters, they include the following trio of Fibonacci Retracement levels based upon declines from key peaks over the past 8 years, to the low in January of this year:
- 23.6% Fibonacci Retracement of 2008-2016 Decline ~38.90
- 38.2% Fibonacci Retracement of 2011-2016 Decline ~39.20
- 61.8% Fibonacci Retracement of 2014-2016 Decline ~37.30
And for good measure, we can add the following 2 key potential points of resistance:
- The Post-2008 Down Trendline (on a log scale), Connecting the 2011 & 2014 Highs ~37.75
- The 1000-Day (approx. 200-Week) Simple Moving Average ~36.86
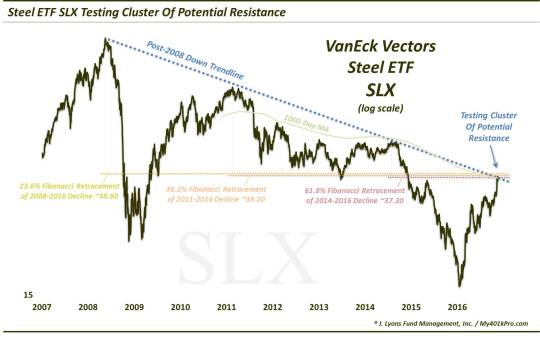
Each of these potential lines of resistance is noteworthy by itself. To have them all clustered in the same vicinity should make this area particularly consequential as an obstacle for this rally in steel stocks.
The cluster of Fibonacci levels is particularly important to us. This lining up of levels from key junctures is precisely what we look for in Fibonacci analysis. It not only creates multiple layers of potential resistance, but it serves as a sort of validation of the market junctures that we’ve identified. This is especially true if the price action respected the lower Fibonacci levels when encountered. In this case, it certainly did as the SLX suffered its largest pullback of its post-January rally after testing the lower “Fibs”, dropping some 23% back in April-May.
Like many commodity-related stocks, steel stocks have most definitely had a great run, both over the course of this year, as well as around the election. Nothing goes in a straight line, however. And if there is any spot on the chart of SLX that looks to offer multiple layers of potential resistance, it is this one near the 37-39 level. It may not be an impenetrable level, but it certainly should test the mettle of the SLX rally in the immediate-term.
_____________
More from Dana Lyons, JLFMI and My401kPro.
The commentary included in this blog is provided for informational purposes only. It does not constitute a recommendation to invest in any specific investment product or service. Proper due diligence should be performed before investing in any investment vehicle. There is a risk of loss involved in all investments.