Will South Korean Test Be A Red Flag For Global Markets?
South Korea, long viewed as a global bellwether, is seeing its stock market testing major long-term support presently.
South Korea has long been considered a bellwether of sorts for the global economy. This is due to a heavy cyclical component to the Korean economy. Now whether or not that distinction is accurate is up for debate. However, if its stock market is a fair barometer of the economy – also up for debate – its performance over the past decade may lend credence to the global bellwether argument. That’s because, while many other global equity markets have broken out to new highs in recent years, South Korea’s main KOSPI Index has been veritable dead money since peaking in 2007. Its sideways performance since has essentially mirrored the lackluster global economy.
In fact, the KOSPI’s high in 2007 was 2064. Its high in 2016, so far, is 2068. And only twice briefly in the past 9 years – in spring 2011 and spring 2015 – did the index surpass those levels. Now it can be argued that the KOSPI is merely building a huge base prior to it eventual breakout and leg higher. Its post-2007 chart pattern does resemble a potential ascending triangle, with higher lows and its horizontal highs. However, the KOSPI better hurry up and break out soon. That’s because it is once again testing the lower support of the potential ascending triangle. This lower bound is represented by an uptrend line that defines its rally since the lows in 2003.
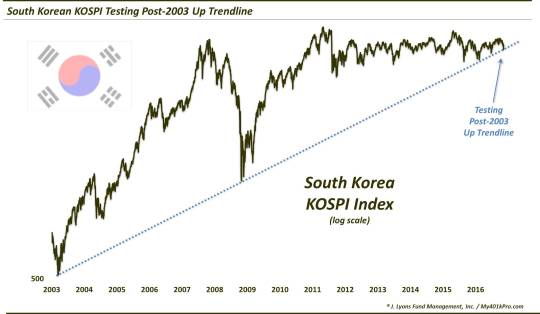
Now, the KOSPI did make a more prominent low in 1998. However, what makes this post-2003 trendline (on a log scale) compelling is that it connects the lows in 2008 and the lows in February and June of this year. The KOSPI is now, once again, testing this defining 13-year Up trendline, near the 1960 level.
We have said often in the past that the more frequent that prices test a trendline, or other support, the more likely it becomes that the line will fail. That’s the challenge now with the KOSPI. After 1 touch in the prior 11 years, the index is now testing the trendline for the 3rd time this year. But if the KOSPI can hold the line, it can make another run at its former highs, some 10% higher. A break below the line, though, could usher in some heavy selling pressure, with our first major potential support level some 10% to the downside.
Either way, if South Korea is indeed an accurate global bellwether, and if the KOSPI is an accurate barometer of Korea’s economic well-being, this trendline test could be a key marker for the global economy.
________
More from Dana Lyons, JLFMI and My401kPro.
The commentary included in this blog is provided for informational purposes only. It does not constitute a recommendation to invest in any specific investment product or service. Proper due diligence should be performed before investing in any investment vehicle. There is a risk of loss involved in all investments.