Intel: What’s Inside The Chart?
The stock of Intel is testing a major confluence of support on its chart – but with a potentially ominous alternate scenario.
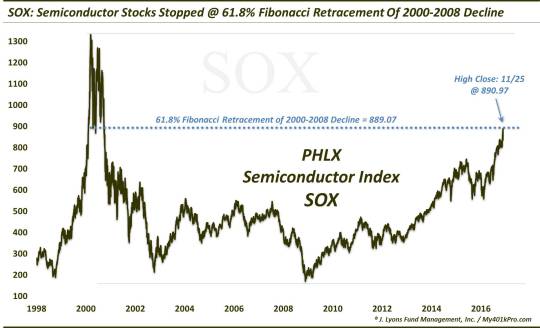
One sector that has been on fire, pre and post-election, is semiconductors. As of election day, the PHLX Semiconductor Index (SOX) was up precisely 50% off of its February low. It proceeded to jump another 7.5% in 2 weeks following the election. Then yesterday happened, i.e., a -5% drubbing in the SOX. Why the rout? One can always concoct any number of explanations for a move. Our best guess?…Fibonacci:
Within the SOX, one of the “goliaths” obviously is Intel (INTC). The performance of INTC naturally has a large impact on the movement of the SOX. That makes the recent action in the SOX all the more impressive. That’s because while INTC had a fine run up from February to October (up almost 40%), it has not participated in chip stocks’ recent good fortunes. In fact, even before yesterday’s selloff, INTC was trading 10% below its October highs. Why the recent difficulties? Why not Fibonacci again?:
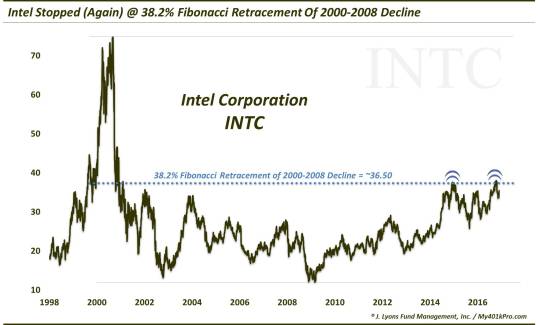
The rejection of INTC at the 38.2% Fibonacci Retracement of its 2000-2008 decline makes it twice in 2 years. It also sets up a potential double-top on the chart (though, that’s probably overrated).
The present selloff does have our attention, however, given the level that INTC is approaching. Specifically, at 33-33.50, the stock is testing a veritable slew of potential support layers.
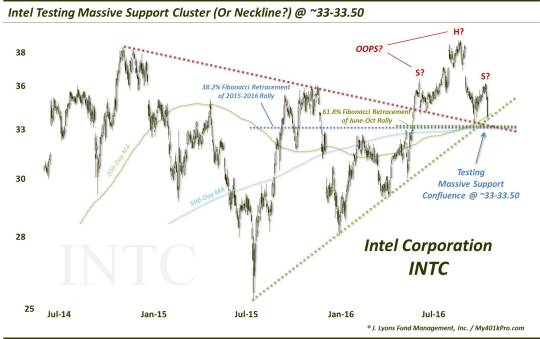
Included among potential support:
-
The Post-2014 Down Trendline – currently ~33.20
- The Post-2015 Up Trendline – currently ~33.40
- The 38.2% Fibonacci Retracement of the 2015-2016 Rally ~33.20
- The 61.8% Fibonacci Retracement of the June-October Rally ~33.50
- The 200-Day Simple Moving Average ~33.40
- The 200-Day Simple Moving Average ~32.75
Those multiple layers of support supply the good news for INTC stockholders, or those looking to buy the dip. On the other hand, there is one potential red flag sticking out like a sore thumb on the chart.
Last week’s high around 35.60 occurred in the same vicinity as the high back in mid-July. Those peaks are sandwiched around INTC’s multi-year high in October, north of 38. Plenty of technicians might interpret that pattern to be a head-&-shoulders. Of course, the H-&-S is historically a bearish pattern, resulting in materially lower prices once the lows between the shoulders (i.e., the neckline) are taken out. By traditional standards, a break of the neckline (currently around 33.30) would open up approximately 10% of additional downside to near the 30 level.
For INTC bulls, the good news is that most of these potential H-&-S patterns don’t pan out. Their identification can only be assessed after the fact, obviously,.and as often as not, the H-&-S call ends up being premature as prices eventually move above the right shoulder.
The other good news is that the amount of potential support in the 33-33.50 area should at least be sufficient for a bounce. Should the bounce surpass the right shoulder, the H-&-S pattern will be negated.That doesn’t necessarily insure a higher high until INTC is able to take out its October high/38.2% Fib Retracement level. That feat could spur on the next longer-term up-leg in the stock.
Right now, the focus is on this key 33-33.50 level. INTC’s decision around that level should dictate the direction of its next solid move.
_____________
More from Dana Lyons, JLFMI and My401kPro.
The commentary included in this blog is provided for informational purposes only. It does not constitute a recommendation to invest in any specific investment product or service. Proper due diligence should be performed before investing in any investment vehicle. There is a risk of loss involved in all investments.


