Will Spilling Coffee Prices Get A Jolt Here?

Down over 20% just since election day, coffee prices may presently be testing a key level of support.
The out-sized moves set in motion on election day in many of the major financial markets certainly represent the biggest investment story of the back half of 2016. It was an under-the-radar market, however, that we chose as our Chart Of The Day that day. At the time, coffee prices were on a tear. As represented by the S&P GSCI Coffee Index, coffee was up more than 60% off of its January lows and up over 20% just in the month leading up to election day. Despite coffee’s red-hot run, we noted a few reasons why the “Buzz Could Wear Off” in an election day post (actually posted in the wee hours on election night):
“…despite the fact that we are staunch believers in the concept of relative strength (i.e., sticking with the up-trending markets), there are circumstances currently that make us suspect of continual upside in coffee over the near-term. One is the fact that prices are hitting the 5-year Down trendline (on a linear scale) stemming from the highs in 2011 and connecting the tops in 2014, demonstrated here by the S&P GSCI Coffee Index. Additionally, there is potential price resistance just above via Fibonacci Retracements stemming from the 2011 and 2014 highs.”
…another factor…may be a…substantial headwind should some selling commence. According to the CFTC, Commercial Hedgers in coffee futures are holding their largest net short position in the history of the contract. The concern is that these Hedgers most often represent the “smart money” once positioning gets to an extreme. Thus, this record net short position indicates a potential negative for coffee prices, should they begin to reverse lower.
As it turns out, these concerns were warranted as coffee prices actually topped out on election day. Since then, it hasn’t been pretty. In just 7 weeks, the GSCI Coffee Index has dropped more than 23%. The good news, however, for coffee bulls is that prices are now hitting an area containing a cluster of potential support levels.
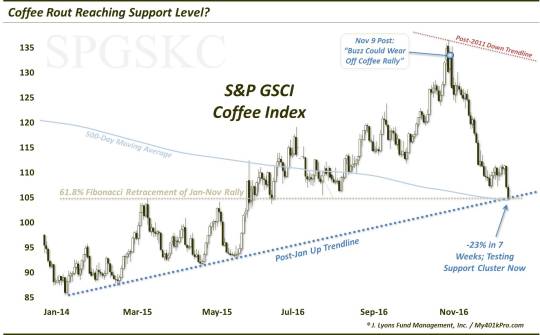
At around 104 currently, the GSCI Coffee Index is testing the Up trendline stemming from its January low and connecting the February-March and May-June lows. Also residing at the same level is the key 61.8% Fibonacci Retracement of the January to November rally. Lastly, the 500-day simple moving average is presently sitting in the same vicinity.
One continuing concern is the level of Hedger shorts in coffee futures. While they have covered over half of their record net-short position from early November, they are still holding a sizable net-short position. It may not represent the potential headwind that it did in early November, but it is still far from a tail wind for coffee prices.
That said, while we don’t prefer to catch falling knives, the confluence of technical levels at current prices should be good enough for a temporary bounce at least – even if momentum from the recent drop eventually exerts more downside pressure.
_____________
More from Dana Lyons, JLFMI and My401kPro.
The commentary included in this blog is provided for informational purposes only. It does not constitute a recommendation to invest in any specific investment product or service. Proper due diligence should be performed before investing in any investment vehicle. There is a risk of loss involved in all investments.