
Stocks Boast Record Run Of Buoyant Behavior
The Nasdaq 100 has never had a run of strong closes like it is currently demonstrating.
If it seems like the stock market has had a good run of it lately, you’re not imagining things. Stocks across the market cap spectrum have been on a remarkable run of both up days as well as new highs. Furthermore, if it seems like the market has been closing firmly on a consistent basis, you are not mistaken. In fact, in some respects, the recent run of strong closes is unprecedented. To wit:
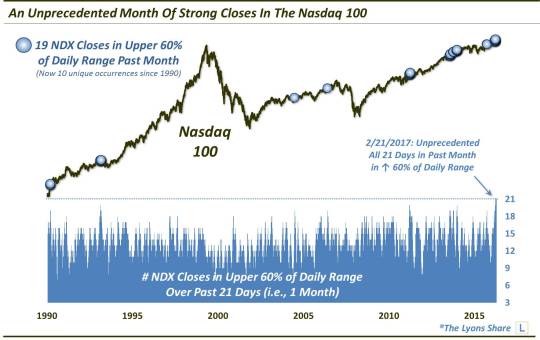
Looking at the Nasdaq 100 (NDX), we note a tremendously consistent inclination for strong closes of late. Specifically, over the past month (i.e., 21 market days to us data crunchers), the index has closed in the upper 20% of its daily range on the majority of days. Even more remarkable has been the index’s ability to avoid weak closes. Over the past month, the weakest finish for the NDX was at the bottom 42% of its daily range. In other words, all 21 days in the past month have seen the NDX close in the upper 60% of its daily range.
If that seems unusual, you are correct again. In fact, the Nasdaq 100 had never before managed to register an entire month’s worth of consecutive closes in the upper 60% of their respective daily ranges.
So what does this unprecedented display of buoyant behavior tell us about future performance? If you have followed our research at all in the past, you know we like to find studies whose results at least suggest some sort of an edge in the markets, up or down. Otherwise, what’s the point but to spout some unhelpful stock market trivia?
Well, not every study, however interesting, elicits an unambiguous edge. As such, this one arguably leans toward the Cliff Clavin category of useless market trivia. Though, it’s not for a lack of looking and parsing the data.
For example, as the markers on the chart illustrate, we did break down all of the 21-day periods in the NDX containing at least 19 closes in the upper 60% of their daily ranges. This produced 9 prior unique occurrences in the index’s history. In the aftermath, aggregate returns were lackluster in the shorter-term, but not consistently enough or bad enough to be too compelling (note that these numbers reflect performance once the streaks drop below 19 of 21 days):
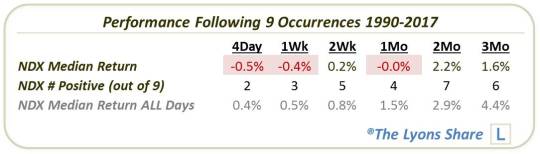
The numbers loosely suggest that once the streak drops below 19 out of 21 days, the NDX might be in for some short-term stagnation. Then again, we are dealing with a sample size of just 9, and the numbers are not overwhelmingly negative. Therefore, perhaps it is best not to draw any concrete conclusions from the data about where the NDX is headed, but simply acknowledge the ongoing trend.
It is said that the “smart money” trades in the last hour of the day. If that is true, considering we are witnessing an unprecedented string of strong closes in the market, the smart thing may be to avoid fighting the trend until it runs its course.
_____________

Like our charts and analysis? Get an all-access pass to our complete macro market analysis at our new site, The Lyons Share (plus, sign up by February 28 to take advantage of our special launch deal).
Disclaimer: JLFMI’s actual investment decisions are based on our proprietary models. The conclusions based on the study in this letter may or may not be consistent with JLFMI’s actual investment posture at any given time. Additionally, the commentary provided here is for informational purposes only and should not be taken as a recommendation to invest in any specific securities or according to any specific methodologies. Proper due diligence should be performed before investing in any investment vehicle. There is a risk of loss involved in all investments.