
Tech Stock Rally Getting Extended
The Nasdaq 100 rally is arguably extended now, based on the utilization of this charting analysis.
We have mentioned, on occasion, our view that the concept of rotation in the equity market is a bit overplayed. Sure, there are always some things going up on others going down, but that’s the nature of the markets. It doesn’t mean it is part of some coordinated rotation whereby various segments of the market take turns carrying the leadership mantle. In fact, it is estimated that some 70%-80% of the movement of a stock can be explained by the direction of the overall market. With that being said, in the last eight months or so, the stock market has probably exhibited more “rotational” characteristics than any other period in recent memory.
Others have pointed to the multi-year lows in stock correlations. It is part of the same concept. The recent rotation among stocks segments has been interesting to say the least, not to mention an attractive environment for active managers. Some groups of stocks rally while others consolidate; some break out while others pull back; some are extended while others are poised to make a move. Presently, you might place technology stocks, or specifically the NASDAQ 100, in the “extended” category.
Our rationale for that characterization is not just because the NDX is up 23 out of 29 days this year, although that helps. The premise is based on charting technique involving the Fibonacci mathematical sequence of numbers. As we have mentioned before, the Fibonacci sequence is a repeating pattern found in all walks of life, including the financial markets. We have found, as have others, that prices often move in approximate increments corresponding to the Fibonacci sequence. One example is with “extensions”.
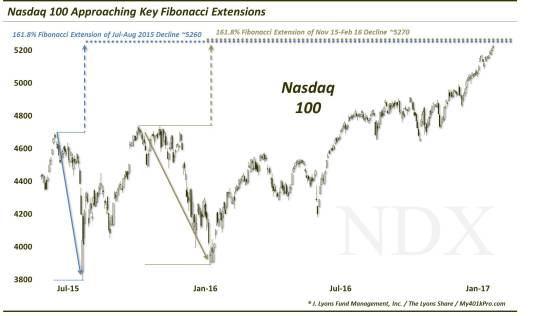
Fibonacci extensions relate to the incremental moves that prices exhibit following a break out of a range. In this case we are looking at the NDX’s ranges corresponding to its declines from July-August 2015 and from November 2015-February 2016. Once the NDX finally broke above those ranges last summer, we could start measuring its “extension”. We measure it as a percentage of the range and monitor certain percentages that correspond to the Fibonacci sequence.
The most significant percentage in Fibonacci is 61.8%, or 0.618. That is the figure resulting from dividing one Fibonacci number by the next one in the sequence. In Fibonacci Extensions, we look for a 61.8% move above the previous range as a potential key marker. This level, expressed as a 161.8% extension of the range, is presently being reached on the chart of the NASDAQ 100 near 5260-5270.
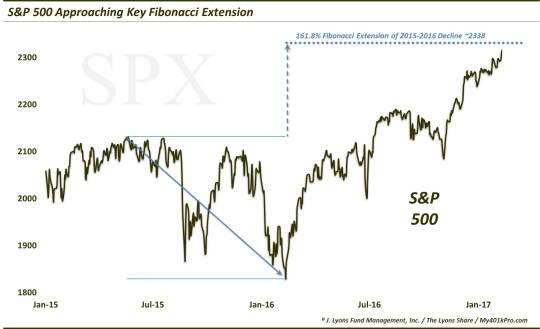
As it happens, the S&P 500 is also approaching a similar extension of its 2015-2016 decline near 2338.
Is this an automatic sell signal or short signal? Markets are never so straight-forward that we can rely on a single indicator. There are many considerations that we take into account – this is just one of them. And if the collective components of our (more critical) proprietary Risk Model are suggesting that conditions are still favorable for stocks, which they are, that would certainly take precedence. However, we do take this Fibonacci Extension development seriously, even if it does not override our Model’s signals.
It has been said that one “can’t go broke by taking profits”. And while many may disagree with that practice (and we understand their “slippery slope” rationale), as active risk-managers, there are definitely occasions when we would deem that strategy appropriate. Now is one of those occasions.
_____________
Photo is of IBM’s 1950′s supercomputer, appropriately named “Stretch”, with its 30 feet in length.
Like our charts and analysis? Get an all-access pass to our complete macro market assessment at our new site, The Lyons Share.
Disclaimer: JLFMI’s actual investment decisions are based on our proprietary models. The conclusions based on the study in this letter may or may not be consistent with JLFMI’s actual investment posture at any given time. Additionally, the commentary provided here is for informational purposes only and should not be taken as a recommendation to invest in any specific securities or according to any specific methodologies. Proper due diligence should be performed before investing in any investment vehicle. There is a risk of loss involved in all investments.