Can Oil Stocks Hold Their “Line In The Sand”? (PREMIUM-UNLOCKED)
This is a FREE look at a Premium Post from The Lyons Share, our new service providing an “all-access” pass to our charts and research.
Oil stocks are again testing important support stretching back 3 decades – how long will it continue to hold?
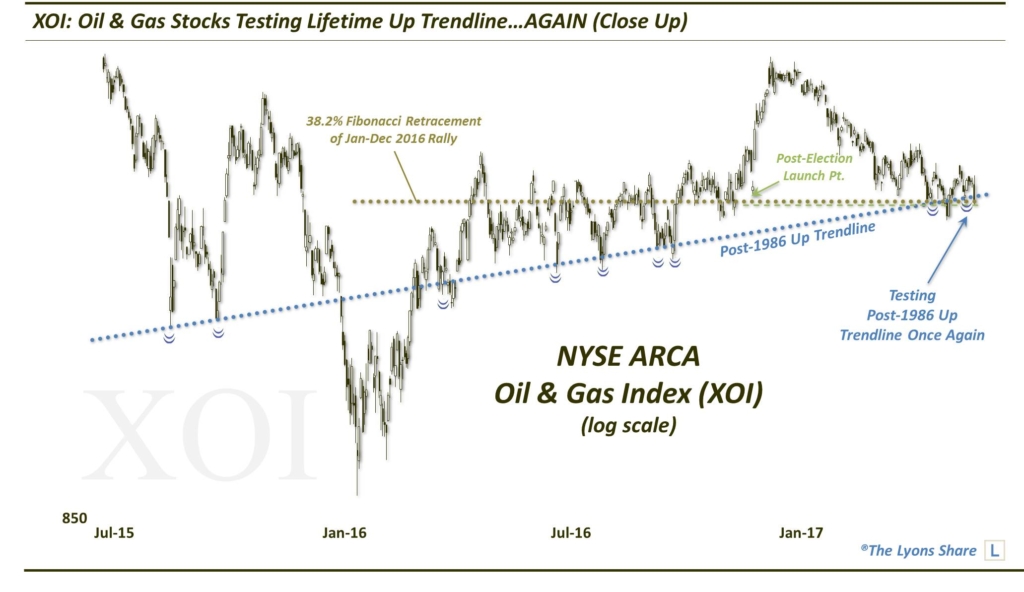
About a month ago, we pointed out the approaching potential support in the beleaguered oil stocks. Specifically, the NYSE ARCA Oil & Gas Index (XOI) was hitting a cluster of meaningful support levels near the 1140 mark including,
- The March 27 Initial Low ~1147
- The November Post-Election Launch Point ~1125-1142
- The 38.2% Fibonacci Retracement of the January-December 2016 Rally ~1139
We surmised that these levels alone should be enough to spark at least a mean-reversion bounce in oil stocks which had lagged badly since the beginning of the year. But if that weren’t enough, the piece de resistance (or, piece de support??) was the presence of the XOI’s lifetime Up trendline which was intersecting the same 1140-ish area. Considering the trendline had been in place for 3 decades, it was a boost of confidence that the level should in fact hold for the time being.
Well, outside of a 1-day “fakedown” on May 4, the level has indeed held. However, any meaningful mean-reversion bounce has been elusive. Outside of an initial 4% pop in the days following the previous post, the XOI has had trouble getting off of the mat. Today, we find it once again testing its 30-year “line in the sand” as we first coined the trendline over a year ago.
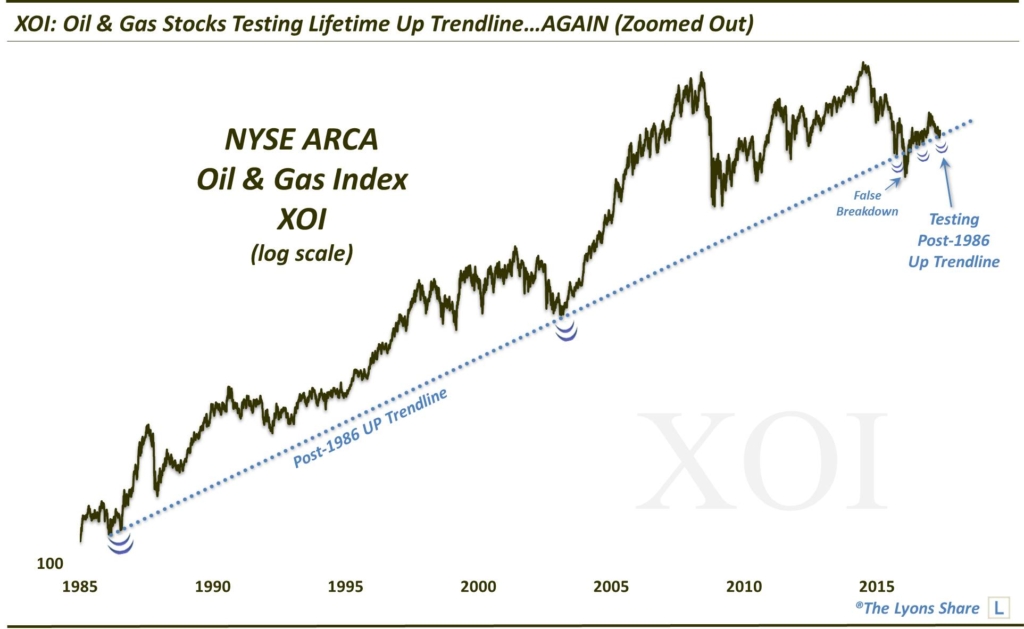
Here is a closer look at the recent action in the XOI vis-a-vis the trendline. Notice how, despite the age of the trendline, and the fact that it suffered a large false breakdown in early 2016, it continues to serve as the defining factor in directing the XOI price. Close to double digit times over the past few years, we saw the trendline hold precisely as support for the XOI. Oil bulls need it to do so again right now.
So do we think it will continue to hold? It remains possible, as we stated in the April post, that this action is still part of a retracement test of the post-election rally. If so, oil stocks should hold the trendline again and resume their leadership that they displayed throughout 2016.
However, there are a few aspects of the recent action that we don’t like, as far as the prospects go for oil stocks. First off, the repeated testing of the trendline is bound to begin wearing it down, rendering it weaker and weaker with each test.
Especially damaging is the false breakdown on May 4. While a false breakdown can be a powerfully bullish force, the positive ramifications are typically manifested immediately following. In this case, the “fakedown” provided very little lift off of the trendline. This is further evidence of the weakening of the trendline. Recent tests of the line have resulted in relatively meager bounces off.
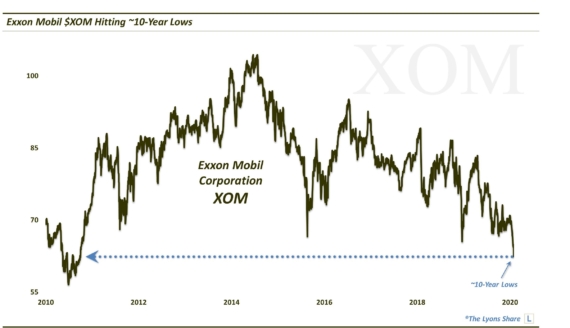
Furthermore, this performance by oil stocks, and its present proximity to the long-term trendline, has come about despite a very positive environment overall for stocks. With major averages sticking near all-time highs, the fact that oil stocks are plumbing 52-week lows is very discouraging. Perhaps oil stocks will be a safe haven of sorts and a destination for rotated money should the general stock market top and begin to correct. That is really a reach, though.
More likely, oil stocks are in a precarious spot – and made more precarious by the fact that the broad market has precious margin for error here at nose-bleed levels. It isn’t that the broad market looks that vulnerable, but oil stocks may need the general market to continue its inexorable rise just to keep them afloat. That may be too tall of a task.
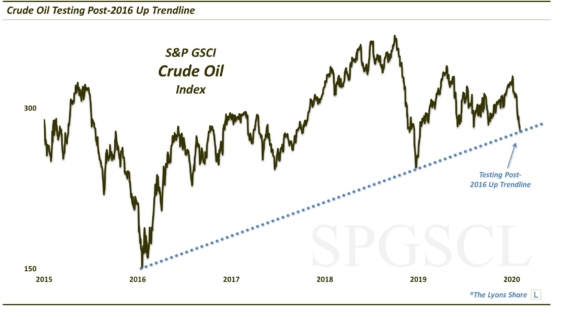
Otherwise, oil stocks may need oil itself to embark on a strong advance. However, the trouble there too is the fact that crude oil has had a pretty good run over the past 15 months. Recent action has put a damper on that rally, however, and the commodity looks susceptible to at least a deeper retracement of the post-2016 rally. If that transpires, it will obviously be a head wind for oil stocks.
Lastly, one vehicle in which to take advantage of rallies in oil stocks is the Energy SPDR ETF, ticker XLE. Here too, we see evidence of softness in breaching what was, in our view, a decent confluence of support near the 67.50 level. Sure, prices can reclaim that level. But the breakdown opens an easier path lower in the XLE.
The bottom line is that the inability of oil stocks to sustain any meaningful upside despite favorable environments in the broader equity market and in crude oil should be a serious concern for oil stock bulls. Furthermore, the potential springboard in the 30-year Up trendline has not proven very springy of late. At this point, more so than at other recent tests of the trendline, the XOI looks increasingly vulnerable to breaking down below the “line in the sand”.
Members of The Lyons Share get tons of these charts and research every day. If you’re not a member, now is the perfect time to join us as we have extended our Spring Sale through Memorial Day.
_____________
Disclaimer: JLFMI’s actual investment decisions are based on our proprietary models. The conclusions based on the study in this letter may or may not be consistent with JLFMI’s actual investment posture at any given time. Additionally, the commentary provided here is for informational purposes only and should not be taken as a recommendation to invest in any specific securities or according to any specific methodologies. Proper due diligence should be performed before investing in any investment vehicle. There is a risk of loss involved in all investments.