
Will Chart Setup Drive This Sector Higher? (PREMIUM-UNLOCKED)
**The following post was originally sent to premium TLS members on June 8, 2017.**
From several chart angles, the auto parts space looks like a good risk/reward setup presently.
One hallmark of the bull market in U.S. equities over the past 12 months has been the continual emergence of new groups with favorable technical setups. Call it rotation or whatever, there has been no shortage of positive-looking charts at any given time. Even now, well into the rally, we continue to see new groups pop up to provide good risk/reward setups for entry into this market. One such group presently is the auto parts sector.
Looking at the chart of the Dow Jones U.S. Auto Parts Index, we see 2 potential interpretations – both very bullish (and both could be relevant simultaneously):
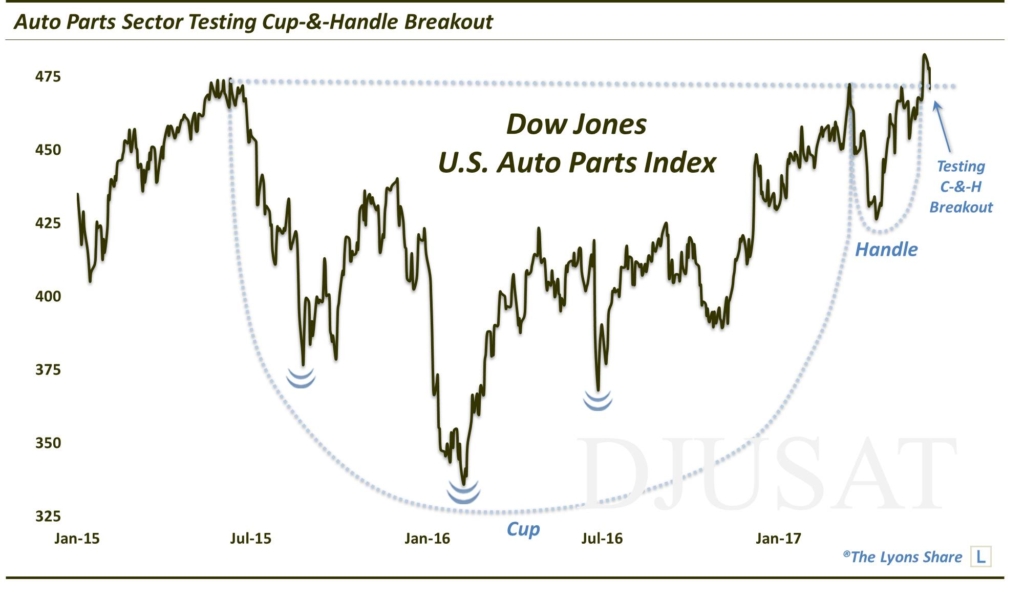
One is a potential cup-&-handle since 2015. Once again, the 2 parts generally show the following characteristics:
The Cup: This phase includes an initial high on the left side of a chart (e.g., the May-June 2015 high around $470), followed by a relatively long, often-rounded retrenchment before a return (e.g., March 2017) to the initial high.
The Handle: This phase involves a shorter, shallower dip and subsequent recovery to the prior highs (e.g., the March-May 2017 period here).
The bullish theory is predicated on the idea that after taking a long time for a stock to return to its initial high during the “cup” phase, the “handle” phase is much briefer and shallower. This theoretically indicates an increased eagerness on the part of investors to buy the stock since they did not allow it to pull back nearly as long or as deep as occurred in the cup phase. Regardless of the theory, the chart pattern has often been effective in forecasting an eventual breakout and advance above the former highs.
The other potential interpretation is an inverse head-&-shoulders pattern. This pattern consists of a major low (head), e.g., in February 2016, flanked by 2 higher, proximate lows, e.g., the shoulders. In this case, the left shoulder(s) were in August-September 2015 while the right shoulders were marked by June and October 2016. The neckline is represented by the tops established within the period of the pattern (the same as the top of the cup-&-handle). Once that neckline is cleared, prices have the potential to shoot significantly higher.
Most importantly, in the past few days, we’ve seen prices move above the tops of those 2 potential patterns, seemingly confirming a breakout of the 2 patterns and suggesting substantial further upside.
Prices are also currently obliging investors by retreating to challenge the breakout level around 470. From a risk/reward standpoint, this is the best possible time to enter into a position from the long side. That is because a decisive move back below the breakout area would suggest a false breakout and should trigger a stop out on any long positions. That is, if prices move decisively back below the former highs, a false breakout is a strong possibility and one would be well served by “getting out”.
There are no auto parts funds that we know of. However, here are a few of the better positioned auto parts stocks, from a technical perspective, with which to take advantage of this potential opportunity.
DLPH
Delphi Automotive (DLPH) is the 2nd largest stock in the DJ Auto Parts Index. Thus, its performance plays a heavy role in determining the path of the index. Thus, it should be no surprise that DLPH’s chart looks similar to that of the index.
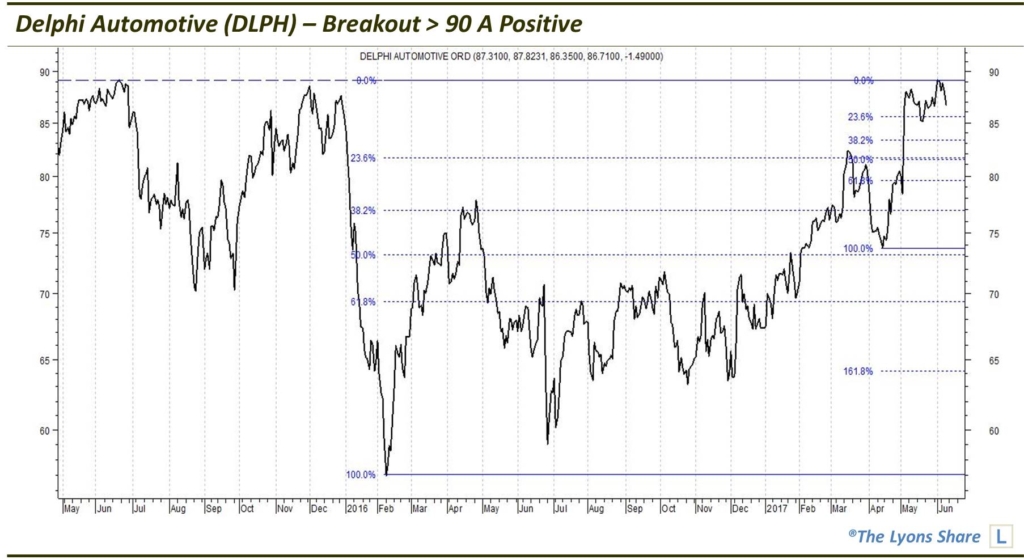
As you can see, while it is not a classic-looking cup-&-handle like we saw with the index, it is similar, and bullish, in our view. Prices just need to decisively break above the 2015-2017 highs around $89, as the index has done. If and when that happens, it will present a good buying opportunity in DLPH — with a stop loss close by on a decisive move back below $89.
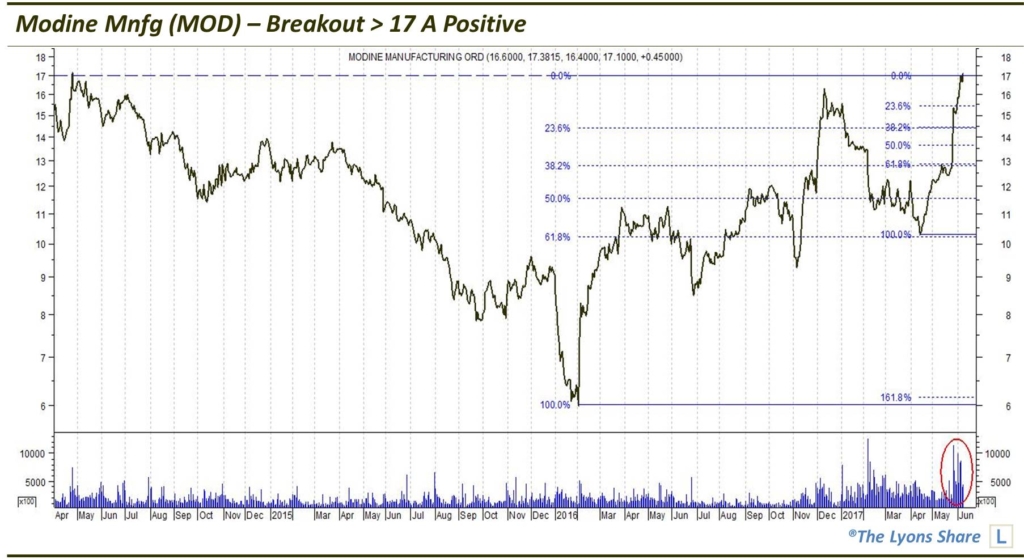
MOD
A smaller company, Modine Manufacturing has a chart more akin to the auto parts index. It is showing potential cup-&-handle and inverse head-&-shoulder patterns. We also like the heavy volume in the stock during the most recent rally. While MOD has not yet broken out either (above it highs near 17), it looks primed to do so. Any decisive break to new highs would warrant long exposure in MOD.
So neither of these 2 stocks, DLPH nor MOD, has broken out yet. Yes, that is a concern. However, if the performance and pattern of the DJ Auto Parts is relevant and consistent with our interpretations, then the index should continue to make its way higher — perhaps, much higher. And if that occurs, these stocks should break out and rally in sympathy.
_____________
Disclaimer: JLFMI’s actual investment decisions are based on our proprietary models. The conclusions based on the study in this letter may or may not be consistent with JLFMI’s actual investment posture at any given time. Additionally, the commentary provided here is for informational purposes only and should not be taken as a recommendation to invest in any specific securities or according to any specific methodologies. Proper due diligence should be performed before investing in any investment vehicle. There is a risk of loss involved in all investments.