A Silver (Trend-)Lining? (PREMIUM-UNLOCKED)
Badly dented over the past 12 months, could the price of silver finally find support at this key technical level?
Silver has had a rough go of it. After essentially quadrupling in a parabolic blowoff from 2008-2011, the metal proceeded to lose roughly 90% of those gains in the subsequent 5 years. Using the iShares Silver ETF (ticker, SLV) as a measuring stick, the round trip went basically from 9 to 48, then back to 13. A promising first half of 2016 had the SLV back up pushing 20 by July — and getting precious metal-heads lathered up again. However, the rug has been pulled back out from underneath them as it has been back to the woodshed again for silver prices over the past year.
There have been a few head-fakes along the way, including a mild bounce into April of this year. However, as we noted in a post at the time, silver speculators had become way too exuberant, especially for such a meager bounce, to expect much more upside at that point. Indeed, the SLV immediately proceeded to drop 14 days in a row, leading towards the depths at which we find prices today.
With SLV now pushing back below 15, metal-heads have become discouraged again, speculating as to what miracle catalyst can come along and save the plummeting metal once again. Well, as it happens, there may possibly be a chance that a key technical level nearby can serve as such a catalyst.
The level to which we are referring also pertains to the SLV. Specifically, it is the lifetime Up trendline in the SLV (on a log scale), beginning at the lows in 2008 and connecting the lows in 2015-2016. Presently, the trendline is intersecting roughly the 14.40 level.
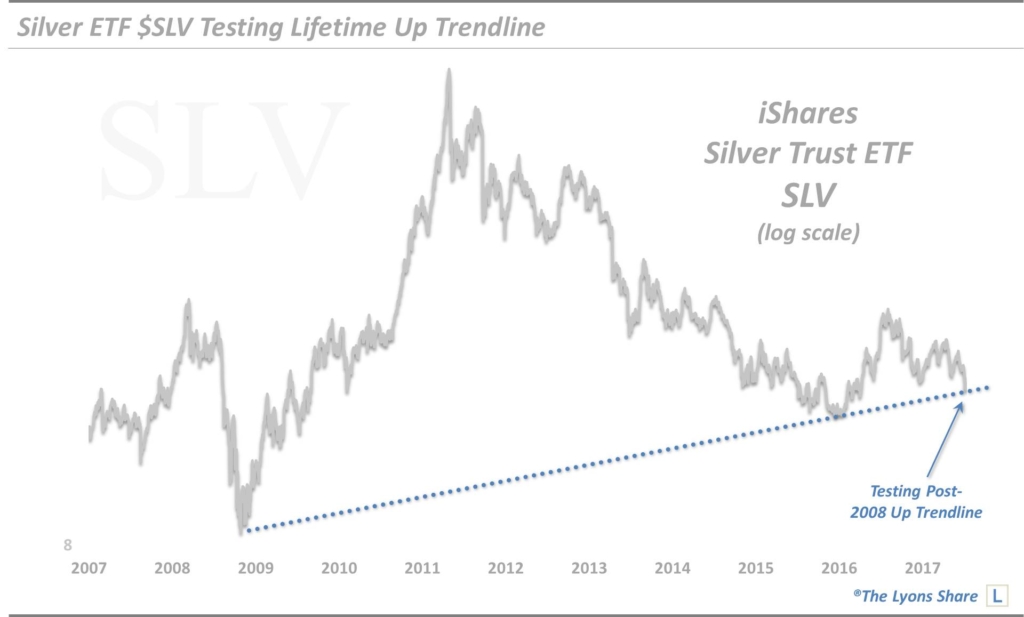
The SLV spiked down to 14.44 on Monday before rebounding strongly. Follow through yesterday has the SLV up just shy of 15. Could this possibly be the bottoming catalyst silver bulls have been looking for?
One problem we have with the idea of this trendline being a catalyst is that, well, it’s not necessarily a trendline. It merely connects 2 points — we prefer at least 3 touches before a line truly qualifies as a trendline. That’s not to say this line is meaningless, or that it won’t hold.
We have displayed countless similar trendlines over the years either in our Chart Of The Day feature or in our #TrendlineWednesday feature on Twitter that have worked out beautifully. These 2-touch trendlines have especially been effective when they are of a long-term nature like this one. So we certainly wouldn’t discount the possibility that this line is indeed a silver lining for the metal and may produce, at least a short-term bounce.
Of course, there are obviously other factors to consider besides this simple trendline, or even the price series in general. For example, what is the status of the record speculation on silver futures that served as the basis for our bearish piece in April? If you’ll recall, at the time the “smart money” Commercial Hedgers held a record net short position of more than 110,000 contracts. From a glance at the updated chart, you’ll see that the situation is much improved.
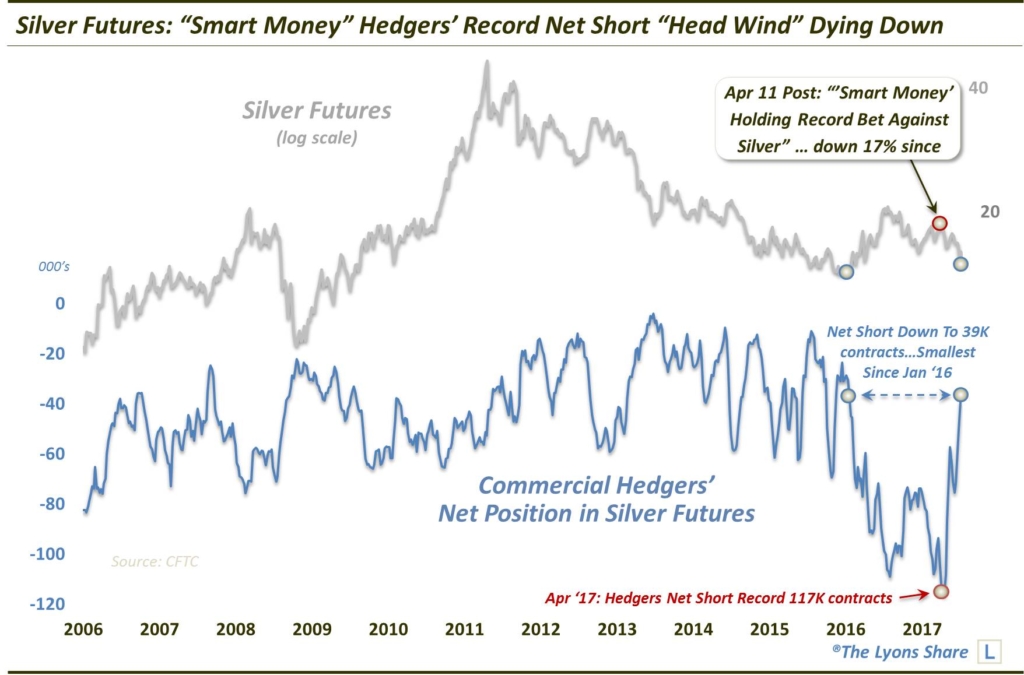
As of last week, the Hedgers’ net short position had dwindled, down to 39,000 contracts. That marks the lowest level since January 2016 when the metal was hammering out a significant low. Now, the short position certainly has room to improve further. However, at a minimum, the major potential head wind that faced silver prices in April based on this factor has been removed.
Lastly, seasonality is turning strongly in favor of silver right now. Specifically, according to Sentimentrader.com, historically:
- Silver’s worst month of the year (by far) is June
- Silver’s best 3-month stretch is July-September
- On average, silver bottoms around the Day 180 of the year — yesterday was Day 190.
So, if silver behaves according to its historical seasonal pattern this year (always a big “if”), it should be entering its most favorable stretch of the year.
Combining that potentially favorable seasonality with much improved trader positioning in silver futures, the metal certainly has the support of other factors as well should the nearby trendline provide a springboard for a silver rally. Therefore, as long as the SLV remains above roughly 14.40, the prospects for a bounce look reasonably good, with the first formidable upside resistance at around 15.75.
_____________
Disclaimer: JLFMI’s actual investment decisions are based on our proprietary models. The conclusions based on the study in this letter may or may not be consistent with JLFMI’s actual investment posture at any given time. Additionally, the commentary provided here is for informational purposes only and should not be taken as a recommendation to invest in any specific securities or according to any specific methodologies. Proper due diligence should be performed before investing in any investment vehicle. There is a risk of loss involved in all investments.