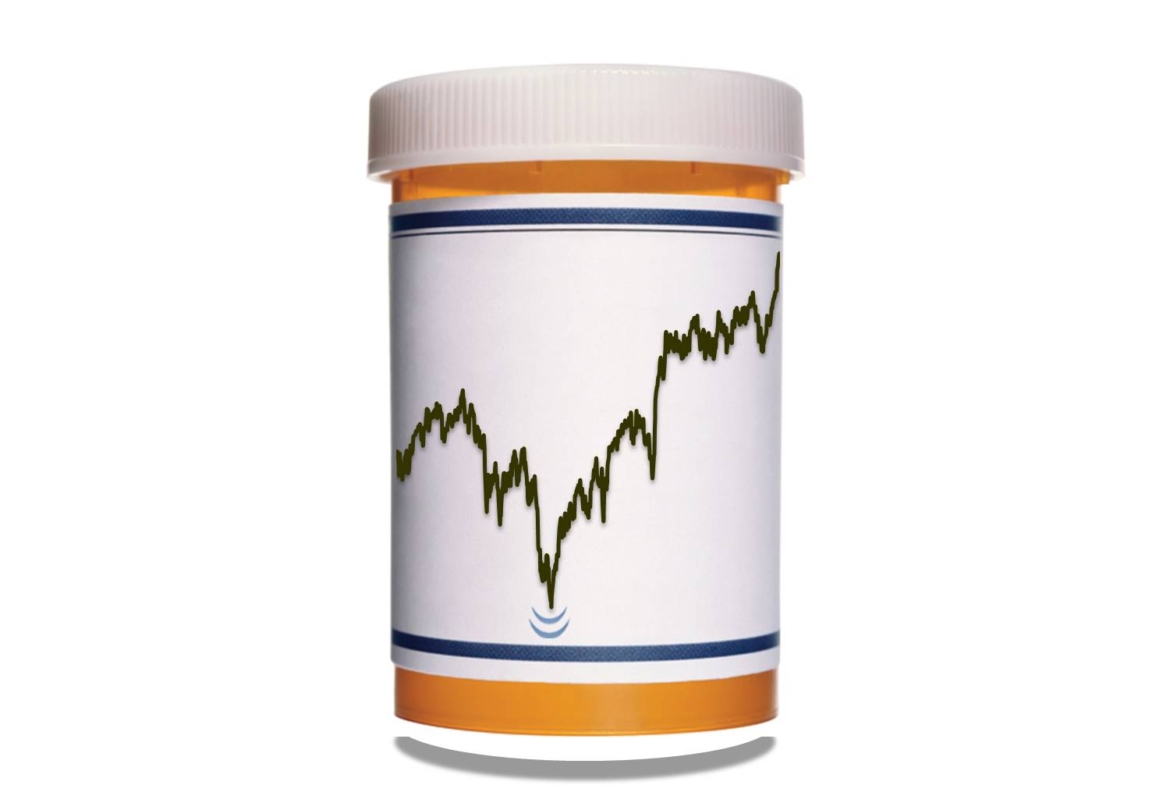
Does Chart Hold Prescription For Bounce In This Drug Stock? (PREMIUM-UNLOCKED)
Merck is testing a confluence of potential chart support near the $55 level.
The stock of pharmaceutical company Merck (ticker, MRK) has been bloodied a bit over the past 2 weeks, dropping from around $64.5 to $54.5. But while a sharp 15% plunge in that short period of time is not our cup of tea, the chart proximity of MRK’s current price may be just the prescription the stock needs to rebound.
Specifically, MRK is testing a cluster of significant potential pieces of chart support near the $55-56 level, including:
- The Post-2009 Up Trendline
- The 23.6% Fibonacci Retracement of the 2009-2017 Rally
- The 38.2% Fibonacci Retracement of the 2012-2017 Rally
- The 61.8% Fibonacci Retracement of the 2016-2017 Rally

Will this $55 level hold? We don’t have a crystal ball. Considering the additional risk considerations associated with single stocks, one news event, earnings mishap, etc. can hurtle a stock beyond what “should” be important support or resistance. That is why we prefer to use ETF’s and funds as it is much more difficult to do that with a fund, i.e., a diversified basket of stocks.
With that said, if we are forced to pick stocks, we want to pick those with the most favorable array of technical evidence in their corner. When it comes to MRK, the assortment of significant potential support levels here near the $55 level is impressive. Again, we do not know if it will hold, but it would appear to be a compelling risk/reward entry point.
How far might it bounce? For now, bounce is the key word. Given the sharp selloff in recent days, it may take some extensive repair work before the stock is able to move to new highs above its former peaks near $66-67. We would expect a bounce to have the potential to test the $62 level anyway — at least, that would be the best level of resistance. Stops along the way might include $57.50, $59 and $60.50.
If the stock does close decisively below that $55 level, one has a very good reason to stop themselves out on the position and reassess down the road.
As you know, we prefer to select our investments based on relative strength, i.e., the stronger areas of the market. But while MRK has gotten beat up just recently, it is still on a path of longer-term higher highs and lows. And the current low around $55 looks like a solid risk/reward entry point for longs in MRK.
If you are interested in the Premium version of our charts and research, check out “all-access” service, The Lyons Share. You can follow our investment process and posture every day — including insights into what we’re looking to buy and sell and when. Thanks for reading!
_____________
Disclaimer: JLFMI’s actual investment decisions are based on our proprietary models. The conclusions based on the study in this letter may or may not be consistent with JLFMI’s actual investment posture at any given time. Additionally, the commentary provided here is for informational purposes only and should not be taken as a recommendation to invest in any specific securities or according to any specific methodologies. Proper due diligence should be performed before investing in any investment vehicle. There is a risk of loss involved in all investments.