Off The Charts: Bitcoin Bombed (PREMIUM-UNLOCKED)
The following post was originally issued to TLS members on February 2, 2018.
The cryptocurrency has gotten blasted — but is it at bombed-out levels?
Following bitcoin’s blow-off top near 20,000 in mid-December, we issued a Premium Post laying out what we thought was the next course of action for the cryptocurrency, including key potential support and resistance levels. As we mentioned in the late December post:
“We expect that this recent reversal puts a near-term top in Bitcoin for the time being. Some correction and consolidation is likely in store over the next few weeks or months. We don’t have any insight as to whether this was THE top or not. That will depend on the corrective action that unfolds.”
We surmised that this consolidation period may see bitcoin trade between possible resistance as high as 17,000 and support as low as 10,600, then 7600 if that level breaks. As it turns out, the cryptocurrency has indeed been stuck in a consolidation, or corrective, pattern. And, before this week, it had traded between a high of 17,161 and a low of 10,771.
Not bad for our charting analysis, especially considering the volatility in this space. As we have been saying all along, however, we should not be too surprised by bitcoin’s adherence to charting levels given its technical “obedience” for some time now. If that continues to hold true, it may be good news for bulls right now.
Yes, bitcoin is presently down 60% from its December highs. But if that surprises anyone, they probably should not trading these products. Besides, bitcoin is still up over 200% from when we first posted on it in late July. The question is, is the run in bitcoin over…or is this a potential opportunity to get back in?
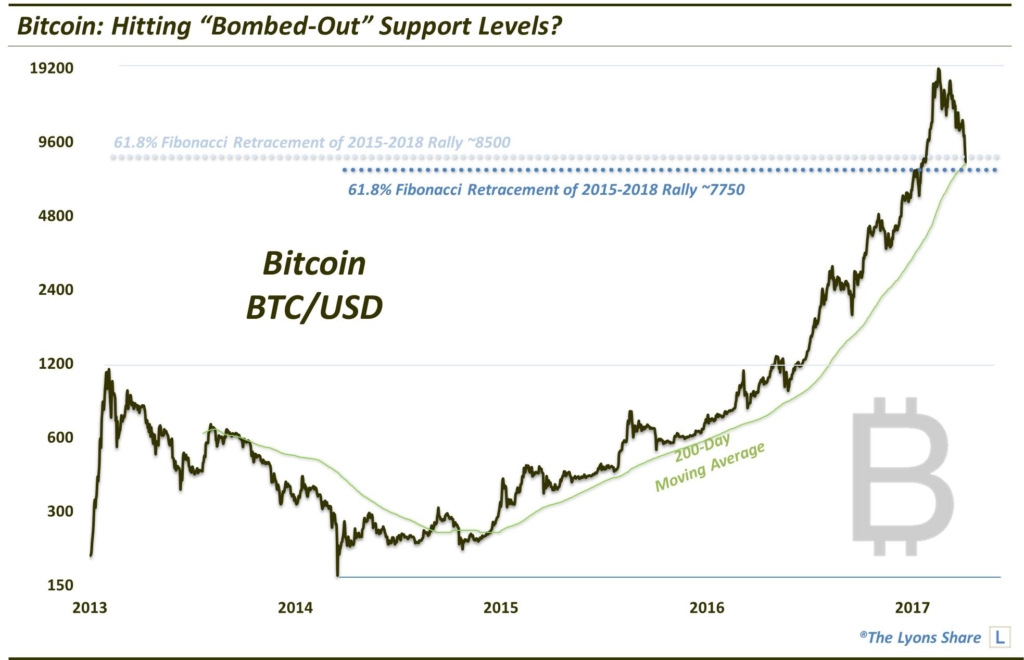
Well, there is no way to know for sure. But if the ride is not over for bitcoin and perhaps other cryptos, we may be hitting levels that represent an opportunity to get back in. Specifically, today bitcoin dropped down near the 7600 level we mentioned in the December post.

This vicinity represents some very key — if not “last-ditch” — support levels, including:
- 61.8% Fibonacci Retracement of 2015-2018 Rally ~8500
- 61.8% Fibonacci Retracement of 2015-2018 Rally ~7750
- 200-Day Simple Moving Average ~7800
IF bitcoin is to hit those insane heights that crypto-nuts are calling for (it’s possible), then this may be a decent spot to take a stab from the long side. Even if it doesn’t go to 1 million, however, it still could easily double off of these levels, just due to mean-reversion alone. Either way, this general vicinity seems to represent a good risk/reward entry into bitcoin, if one has these intestinal fortitude. A decisive close (and hold) below 7000 would remove any interest on our part of owning bitcoin.
If you’re interested in the “all-access” version of our charts and research, please check out our new site, The Lyons Share. You can follow our investment process and posture every day — including insights into what we’re looking to buy and sell and when. PLUS, we are currently commemorating our 1-Year Anniversary with our BIGGEST SALE EVER (for a limited time). Therefore, there has never been a better time to reap the benefits of our risk-managed approach. Thanks for reading!
_____________
Disclaimer: JLFMI’s actual investment decisions are based on our proprietary models. The conclusions based on the study in this letter may or may not be consistent with JLFMI’s actual investment posture at any given time. Additionally, the commentary provided here is for informational purposes only and should not be taken as a recommendation to invest in any specific securities or according to any specific methodologies. Proper due diligence should be performed before investing in any investment vehicle. There is a risk of loss involved in all investments.


