
Chart Trouble For “Tri”-otechs? (PREMIUM-UNLOCKED)
The following post was originally issued to TLS Premium Members on June 12.
A popular biotech ETF is testing potentially formidable resistance on its chart.
Last week, we noted that the a key index of internet stocks was encountering a potential “triple top” on its chart. Of course, if such an interpretation was accurate, it could make for some tough sledding in the internet space. Today’s Chart Of The Day highlights a similar situation in the biotech sector, specifically on the chart of the popular SPDR S&P Biotech ETF, ticker, XBI.
As with the internet index, XBI has formed a potentially ominous triple top, with parallel peaks around the $98 level in January, March and June.
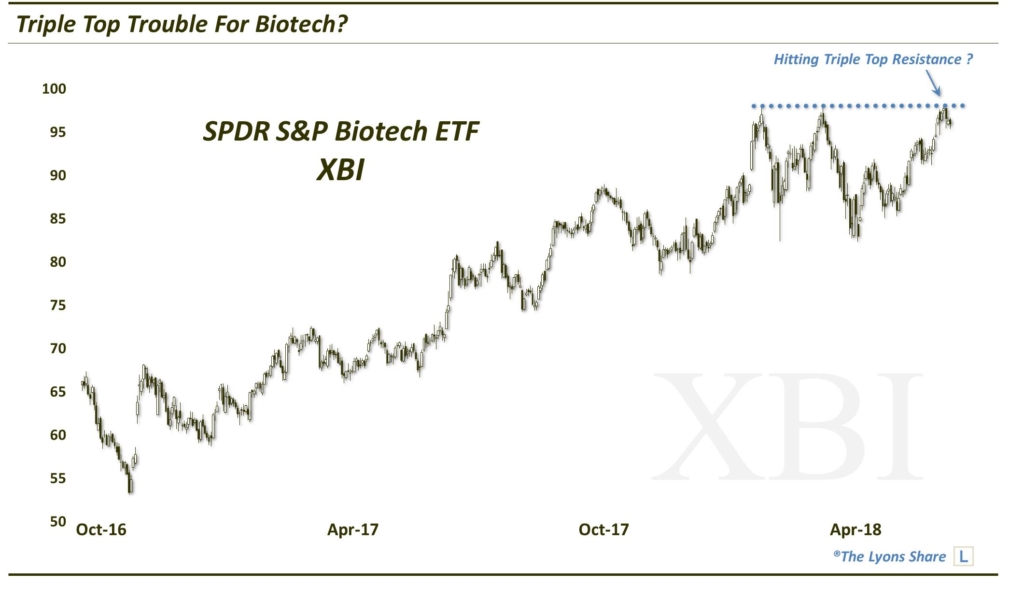
Like we mentioned in the internet piece, should these three peaks hold as resistance, resulting in a true “triple top”, it could have serious implications for the price of XBI. Based on the pattern, the measured downside for the fund could range anywhere from about 26%-33% below the peaks. Of course, if it breaks out above the “triple top”, it’s a completely different story. So obviously, that $98 level bears close monitoring.
Which will it be? We don’t have a crystal ball, but as we surmised with the internet stocks, our vote would be “no” on the triple top. As we stated in the internet piece, “Triple tops”, while they have been major “topping” culprits on occasion throughout charting history, have a very low success rate. In other words, potential triple tops rarely result in actual triple tops once the dust settles. More common is for prices to pause/consolidate, etc. at the level of the initial 2 peaks, before eventually breaking out to new highs.”
Digging a little deeper into the XBI chart, we find good reason for the fund to be consolidating where it is. Scroll back to 2015, and we see the prior all-time high just north of $90. Thus, we do not find it unusual at all that the ETF would be consolidating near present levels. In fact, we find it to be considerably healthy behavior.
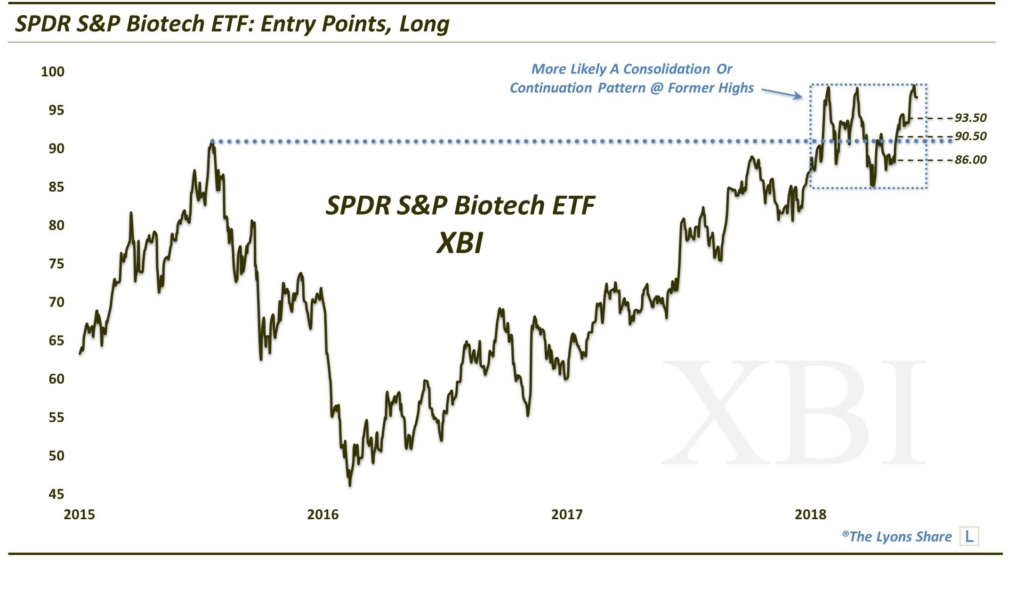
Had XBI simply broken out, and followed through, to new all-time highs earlier this year without first pausing/consolidating/retracing, the breakout would very likely be unsustainable. We say that as a potential breakout on the heals of an already 2-year, straight up rally would no doubt lack the fuel or energy necessary to sustain such a breakout without first regrouping.
So, we find the current consolidation behavior quite healthy, actually, and quite possibly a precursor to an eventual breakout and sustainable new up-leg. Thus, we are long a piece of the XBI, and open to adding more into (ideally) a further consolidation or pullback (FYI, XBI is set up the best of any of the biotech ETF’s, in our view). As you can see on the chart, attractive “add” levels may be in the vicinity of 93.50, 90.50 and 86.
Stay tuned to the Daily Strategy Session chart videos for updates as warranted on developments in these internet tickers.
_____________
Disclaimer: JLFMI’s actual investment decisions are based on our proprietary models. The conclusions based on the study in this letter may or may not be consistent with JLFMI’s actual investment posture at any given time. Additionally, the commentary provided here is for informational purposes only and should not be taken as a recommendation to invest in any specific securities or according to any specific methodologies. Proper due diligence should be performed before investing in any investment vehicle. There is a risk of loss involved in all investments.

