
The Goldilocks Stock Index (PREMIUM-UNLOCKED)
The following post was originally issued to members of The Lyons Share on July 11, 2018; after pulling back to the “buy” levels indicated, the S&P 400 Mid-Cap index has now broken out to new highs.
The mid-cap segment of the equity market may be offering bulls the best set-up at the present time.
If Goldilocks was an equity trader, she would probably have her eye on the mid-cap segment of the market right now – that is, if she was a technician. We say that because among the various market cap options, mid-caps appear to be in the sweet spot right now, from a charting perspective.
Following an impressive run up to new highs, small-caps ran into some key extension levels and, like papa bear’s porridge, appear to be just a little too hot to chase at the moment. Conversely, as we tend to favor high relative strength areas of the market, the lagging large-caps just don’t fit the bill either. They remain stuck in a trading range and well off of January’s highs. Therefore, they’re a bit too cool for our liking. Mid-caps, however, may be just right.
That’s because mid-caps, as represented by the S&P 400 Mid-Cap Index (MID), have demonstrated relative strength of late, bouncing solidly this past week back up near their all-time highs. Plus, as they have not yet broken out and extended themselves into new high ground, they appear to have fuel in their tank still to initiate such a run. And the kicker is, they have potentially formed a cup-&-handle pattern on their chart over the past 6 months.
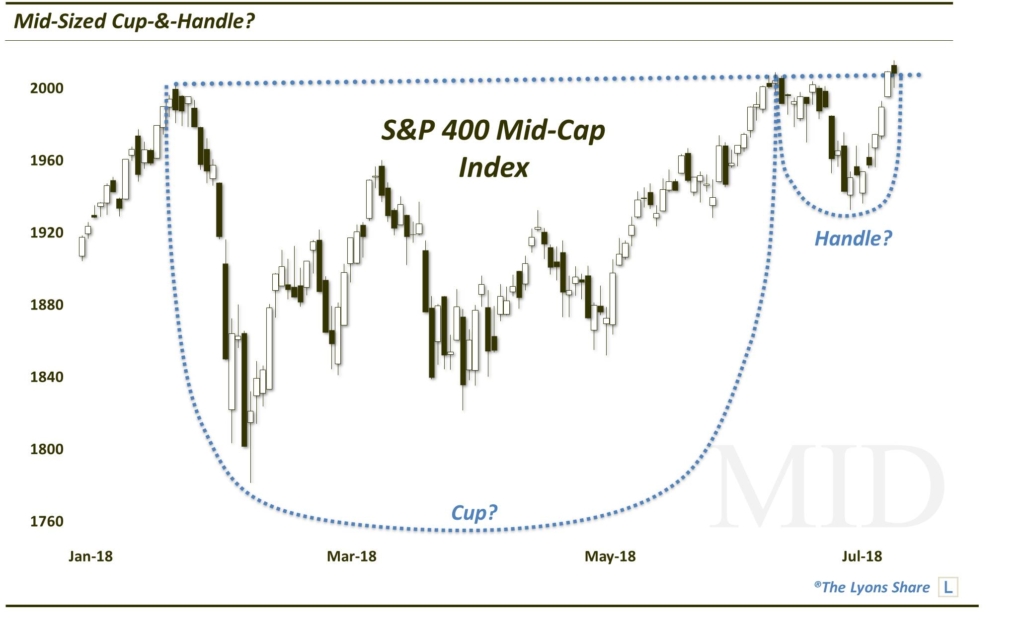
As a refresher, the “cup-&-handle” is historically a pattern with very bullish implications. It involves 2 parts, generally showing the following characteristics:
The Cup: This phase includes an initial high on the left side of a chart (e.g., the January high in MID around 2000), followed by a relatively long, often-rounded retrenchment before a return (e.g., June) to the initial high.
The Handle: This phase involves a shorter, shallower dip in the stock and subsequent recovery to the prior highs (e.g., the June-July stint in MID).
The bullish theory is predicated on the idea that after taking a long time for a stock to return to its initial high during the “cup” phase, the “handle” phase is much briefer and shallower. This theoretically indicates an increased eagerness on the part of investors to buy the stock since they did not allow it to pull back nearly as long or as deep as occurred in the cup phase. Regardless of the theory, the chart pattern has often been effective in forecasting an eventual breakout and advance above the former highs.
So what’s the best way to play this potential setup? There are several mid-cap index tracking funds. The largest is the SPDR S&P MidCap 400 ETF (MDY), which is what we would use as it is the most liquid mid-cap ETF. As is often the case, however, we prefer to use the index (MID) to guide the timing of our trading decisions. While ETF charts can get a bit sloppy due to price distortions, dividends, illiquidity, etc., indices are clean and straightforward so they provide a better guide on levels and timing.
Where would we step in and buy MDY? Judging by the MID, we are looking for one more slight pullback down from the January, June and this week’s highs. Today’s is a good start in that regard. Areas on the MID that would provide a decent risk/reward entry point include 1985 and 1957-1965. We don’t want to see the index close below that 1957 level, though, technically, the pattern could still work as long as the indx remains above ~1938. A close below there wouldn’t necessarily nullify the uptrend, but it would likely nullify the head-&-shoulders pattern.
Regarding targets, should the MID break out to new highs, we’d be looking for, at minimum, a move north of 2060. And ideally, the pattern would project up to ~2100 or ~2145.
Whether or not the bullish implications play out remains to be seen. But versus a too-hot small-cap segment and cool large-cap space, the setup in mid-caps may be “just right”.
If you’re interested in the “all-access” version of our charts and research, please check out our new site, The Lyons Share. You can follow our investment process and posture every day — including insights into what we’re looking to buy and sell and when. Plus, our Pre-FALL Sale (25% OFF!!) is going on now so it’s a great time to sign up! Thanks for reading!
_____________
Disclaimer: JLFMI’s actual investment decisions are based on our proprietary models. The conclusions based on the study in this letter may or may not be consistent with JLFMI’s actual investment posture at any given time. Additionally, the commentary provided here is for informational purposes only and should not be taken as a recommendation to invest in any specific securities or according to any specific methodologies. Proper due diligence should be performed before investing in any investment vehicle. There is a risk of loss involved in all investments.