History Says FANG Feast Is Finished
A comparison to the dotcom bubble suggests the FANG stocks may have topped.
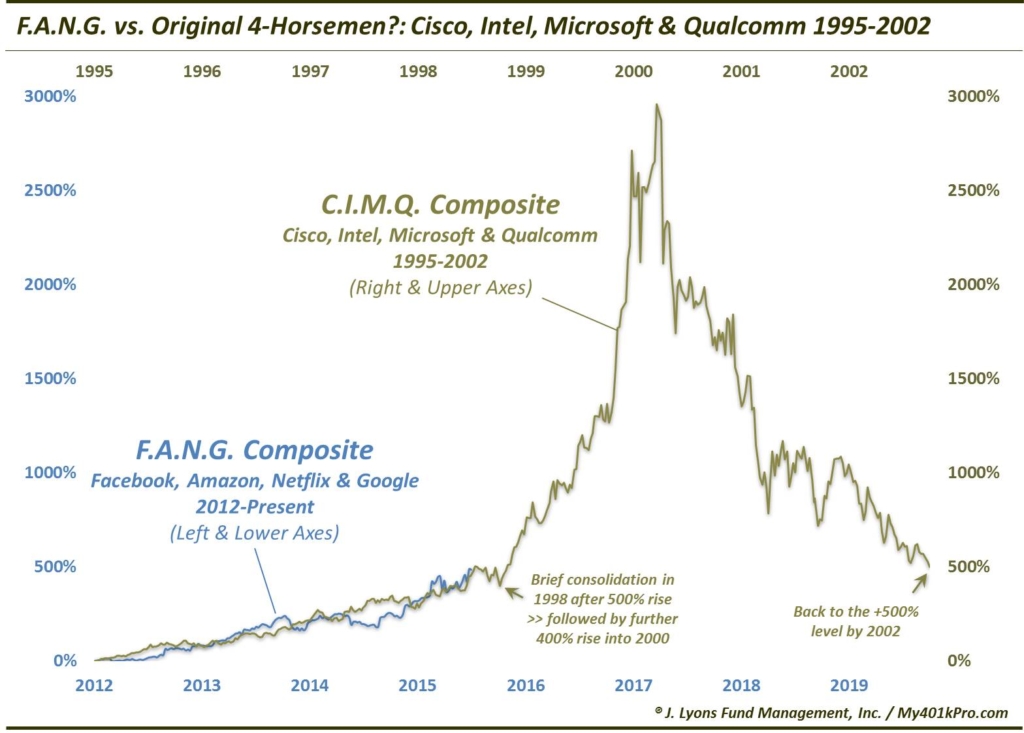
3 years ago, on the day before Thanksgiving, we published a blog piece that remains one of our most popular posts ever. Its subject was the FANG stocks, i.e., Facebook, Amazon, Netflix and Google (Alphabet). At the time, FANG was all the rage, much more so than even today if you can believe it. A composite of the 4 stocks had just achieved a 500% rally in just 3 years. Our post suggested, based on one historical analog, that it was possible the FANG run may actually have further to go — much further.
That suggestion was based on a comparison to another group of former high-flyers that we introduced in the post. Looking to the dotcom bubble, we created another composite, this one of 4 of the leading stocks during the dotcom era: Cisco, Intel, Microsoft and Qualcomm. We labeled this group CIMQ (not as catchy, I know).
We compared the FANG’s 3-year progress vs. the 3-year CIMQ progress from 1995-1998. Our point was that, despite the out-sized FANG gain, the group may have further upside, as the CIMQ group did into the 2000 top. At the time, very few, if any, investors would have believed it was possible for FANG to follow up on their recent 500% gain with an additional 400% appreciation like the dotcom era CIMQ stocks — or much more appreciation period.
Here was our original comparison chart from 3 years ago:
The comparison was not meant as a prediction. Rather, as we stated in the post, our objectives (and conclusions) were more philosophical:
- Trends last longer than one often thinks likely or possible (i.e., it was possible for the FANG run to continue)
- The inexorable FANG ascent can, and likely will, eventually suffer an ignominious fate along the lines of CIMQ (though, perhaps not to the degree?)
- The CIMQ phenomenon was a veritable bubble, and despite the considerable rally in FANG (and stocks, in general), it doesn’t come close to the bubbly dotcom conditions
- Comparisons/analogs like this usually lose their relevance as soon as they are discovered, or published
Regarding the last point, we reserve the right to take a mini-victory lap anyway because the FANG-CIMQ comparison has seemingly continued to maintain its relevance 3 years later. Here is the updated chart:
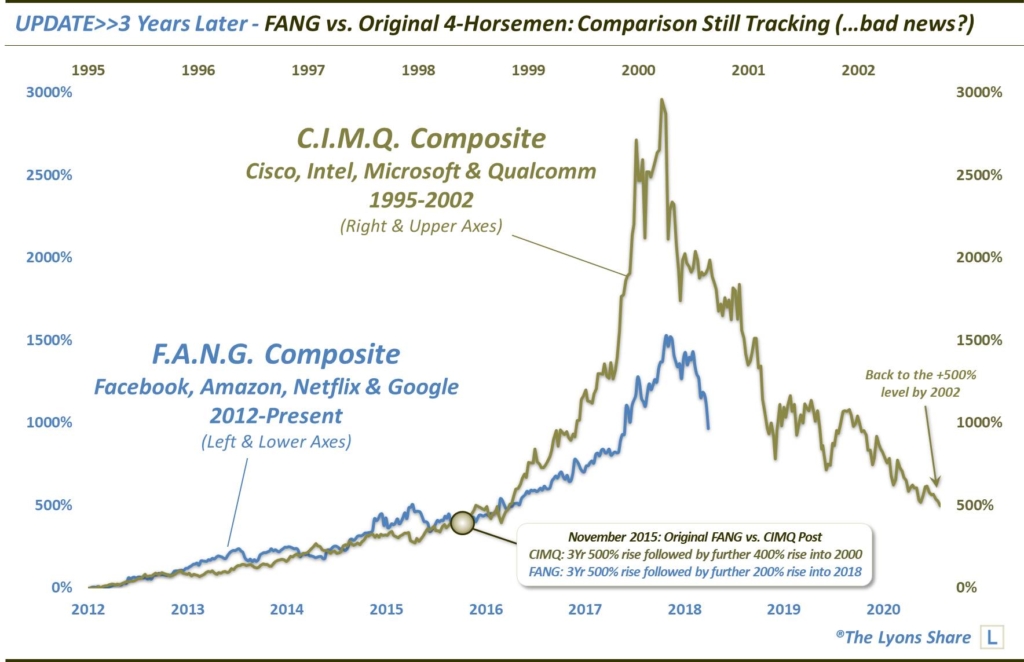
In February of this year, we last updated this comparison. At the time, FANG had doubled off of its November 2015 level — but appeared as if it might be establishing a top of some significance following the early-year selloff. The group would rebound, though, and by June, it had actually tacked on another 100% above its 2015 level. So, less than 3 years following the 2015 post, the FANG stocks had followed their 500% 2012-2015 gain by tripling. It wasn’t another 400% appreciation like CIMQ (see the 3rd bullet point above), but the additional 200% gain into this year was unfathomable to investors in 2015.
Since June, it has been a different story, however. The action over the past 5 months has us pondering whether we really were correct in February when we wondered if FANG’s day were numbered. Given the recent sharp declines in several of the FANG stocks, we felt it was a good time to update the comparison chart to see if, timing-wise, it was tracking CIMQ’s 2000 “ignominious fate”.
When we began to update the comparison chart, we made a slight adjustment to the starting date of the FANG series. Specifically, we moved the start date ahead by 3 months, to September 2012 instead of June 2012. This was not an arbitrary move, however. The FANG group did not begin its sustainable ascent until September of that year, so it was a more appropriate start date, in our view. As indicated by the chart, it also resulted in the very interesting timing of the June peak this year, vis-a-vis the CIMQ comparison.
We will re-emphasize that the main points behind this exercise were philosophical, specifically that trends can last longer than one often thinks likely or possible. The FANG phenomenon certainly did, even if it did not reach to the level of the CIMQ blowoff (a legitimate bubble). However, we will reiterate, based on the bullets above, that there is also an actionable, market-based takeaway. As we mentioned, “the inexorable FANG ascent can, and likely will, eventually suffer an ignominious fate along the lines of CIMQ”.
Is this ignominious fate unfolding now? We will base our assessment of that on current market action rather than this historical CIMQ comparison. As we said, “comparisons/analogs like this usually lose their relevance as soon as they are discovered, or published”. However, it must certainly be unnerving to FANG bulls that the relevance of this comparison has continued to hold up. Because If the comparison continues to hold up, the FANG feast is over.
At least it’s something to chew on over Thanksgiving dinner.
If you are interested in an “all-access” pass to our research and investment moves, we invite you to further check out The Lyons Share. FYI, we are currently holding our BLACK FRIDAY SALE — our BIGGEST SALE OF THE YEAR. So considering the discounted cost and the current treacherous market climate, there has never been a better time to reap the benefits of our risk-managed approach. Thanks for reading!
_____________
Disclaimer: JLFMI’s actual investment decisions are based on our proprietary models. The conclusions based on the study in this letter may or may not be consistent with JLFMI’s actual investment posture at any given time. Additionally, the commentary provided here is for informational purposes only and should not be taken as a recommendation to invest in any specific securities or according to any specific methodologies. Proper due diligence should be performed before investing in any investment vehicle. There is a risk of loss involved in all investments.

