Chinese Stocks Climb Over Wall Of Resistance (UNLOCKED)
China’s Shanghai Composite has vaulted over a major long-term line of resistance.
Global equities had a rough ride in the 4th quarter of 2018. However, no country’s stock market that we track had as rough a year as China’s Shanghai Composite (SSEC) which lost about 25%. Furthermore, as of the end of the year, the index was trading at half the value of its high just 3 years ago. Plus, we observed a particularly troubling technical development this past fall.
In August, we mentioned that the SSEC was testing potentially significant support, including its Up trendline stemming back to 1996. As expected, the index bounced off of the trendline — for about a month. In early October, the SSEC decisively broke the multi-decade trendline, opening the path for further immediate downside. It also established an upside barrier on its chart that would serve as a potentially formidable wall of resistance.
Following its customary lengthy holiday in early February, the Shanghai Composite came out blazing to begin the Chinese New Year. Obviously it had some catching up to do as the rest of the global equity market traded sharply higher while the SSEC was closed. But the Chinese market traded more like it was the year of the bull than the year of the pig, with the index gaining some 7% in the first 10 days after opening back up. That brought the SSEC right back up to the bottom of the broken post-1996 Up trendline.
On Monday, investors in the market got particularly piggish as they pushed the index up 5.6% for the day — its biggest 1-day gain in 3 and a half years. In the process, the index broke back above the multi-decade trendline — and decisively so.
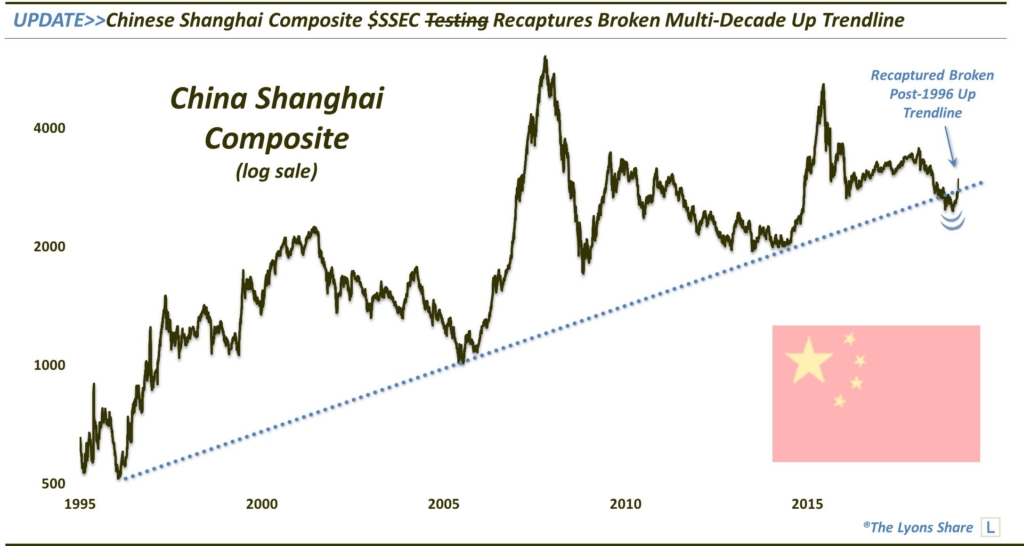
So now what? Is the Chinese equity market in the clear? Not so fast. There is still the problematic presence of a series of lower highs and lower lows on the chart — not to mention the considerable potential resistance given the fact that the market has been falling for nearly 4 years now. However, at least one major potential wall of resistance has been hurdled — and may now serve as important support.
Perhaps the best news is that we wrote an entire post on the Chinese equity market without once mentioning the U.S.-China trade talks (until now). In our Daily Strategy Videos, we will present TLS members with some potential opportunities to take advantage of this development.
If you’re interested in the “all-access” version of our charts and research, please check out our site, The Lyons Share. You can follow our investment process and posture every day — including insights into what we’re looking to buy and sell and when. Plus, we have extended our LAUNCH ANNIVERSARY SALE (33% OFF!!) for 1 more day, so it’s a great time to sign up! Thanks for reading!
_____________
Disclaimer: JLFMI’s actual investment decisions are based on our proprietary models. The conclusions based on the study in this letter may or may not be consistent with JLFMI’s actual investment posture at any given time. Additionally, the commentary provided here is for informational purposes only and should not be taken as a recommendation to invest in any specific securities or according to any specific methodologies. Proper due diligence should be performed before investing in any investment vehicle. There is a risk of loss involved in all investments.