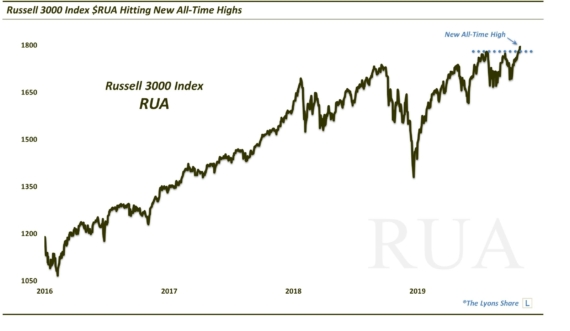
Will Chart Pattern Be Stock Market’s ‘Cup’ Of Tea?
The broad Russell 3000 Index is one of many indices and funds presently forming potential “Cup-&-Handle” formations on the charts; is the pattern the next bullish catalyst for the market?
There are a lot of complex ways of analyzing the directional prospects for the stock market. Indeed, we ourselves have developed complex models that guide our decisions as to when and where to invest. However, in the near-term, sometimes the market’s directional catalyst seems to come down to a simple chart formation. That may be the case right now — and if the interpretation is correct, it may be more good news for the bulls.
The chart pattern in question is the “cup-&-handle”, a potentially bullish setup currently present on the chart of a great number of indices and ETF’s, including the broad-based Russell 3000 Index (RUA):
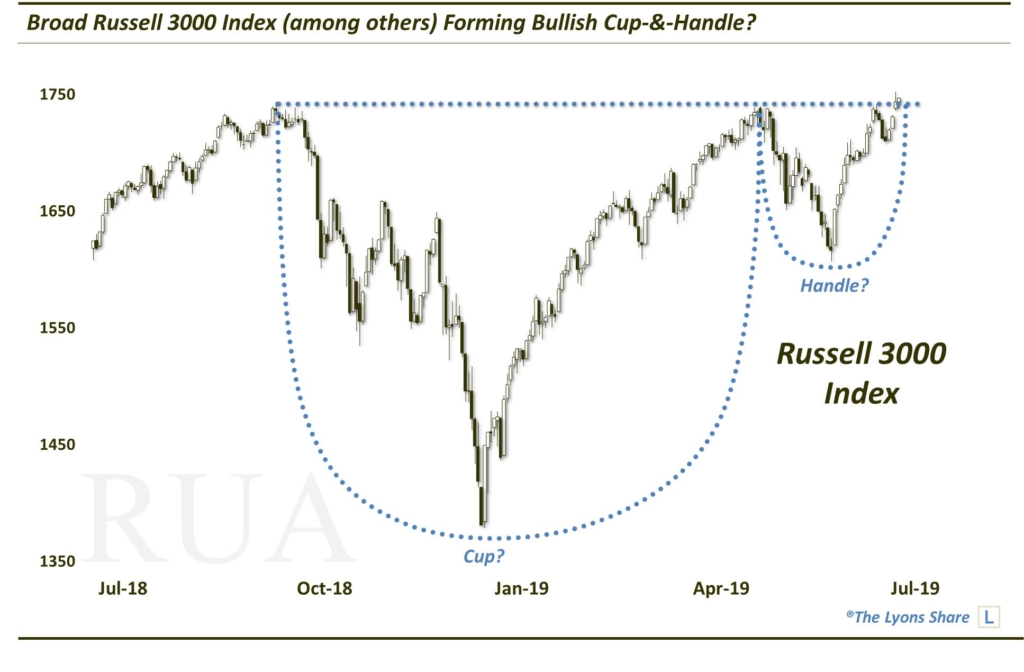
As we have described before in the past, the cup-&-handle pattern is generally a bullish one for prices and involves 2 parts:
The Cup: This phase includes an initial high on the left side of a chart followed by a relatively long, often-rounded retrenchment before a return to the initial high (e.g., September 2018 to April/May 2019 in the RUA).
The Handle: This phase involves a shorter, shallower dip in the stock and subsequent recovery to the prior highs (e.g., April/May 2019 to the present in the RUA).
The bullish idea is that after taking a long time for a stock to return to its initial high during the “cup” phase, the “handle” phase is much briefer and shallower. This theoretically indicates an increased eagerness on the part of investors to buy the stock since they did not allow it to pull back nearly as long or as deep as occurred in the cup phase. Regardless of the theory, the chart pattern has often been effective in forecasting an eventual breakout and advance above the former highs.
Over the past few days, the RUA has been attempting to break out above its all-time highs represented by the top of the cup-& handle. Furthermore, a great many other indices, domestically (e.g., the SPX, the DJIA, etc.) and abroad (e.g., EAFE, ACWI, Global Dow, India, etc.) as well as sectors and ETF’s (e.g., the DRG, XLK, XLY, IGV, etc.) are forming, or breaking out of, similar patterns.
This collective setup across a large portion of the stock market may well serve as the overriding catalyst for the stock market in the near to intermediate-term — and would appear to bode well for continued good news for stock bulls.
Want to know how we are playing this pattern — and in which areas of the market? We invite you to check out The Lyons Share, a daily “all-access” pass to our research and investment moves. Given what should be an exciting, volatile and opportunistic forthcoming market climate, there has never been a better time to reap the benefits of our risk-managed approach. Thanks for reading!
_____________
Disclaimer: JLFMI’s actual investment decisions are based on our proprietary models. The conclusions based on the study in this letter may or may not be consistent with JLFMI’s actual investment posture at any given time. Additionally, the commentary provided here is for informational purposes only and should not be taken as a recommendation to invest in any specific securities or according to any specific methodologies. Proper due diligence should be performed before investing in any investment vehicle. There is a risk of loss involved in all investments.