
Bitcoin Battleground – Part 2 (PREMIUM-UNLOCKED)
The following post was originally issued to TLS members on November 22, 2019. See updated chart at the bottom of the post.
Another window of opportunity here for bitcoin bulls?
If at first you don’t succeed, stop yourself out and try the trade again at better prices. So it goes at least with our bitcoin strategy. 10 days ago, we mentioned the attractive risk/reward setup in the cryptocurrency on the long side. It had broken through some key resistance near the 8500 level and was dropping back to test that breakout level. Thus, it seemed like a low-risk entry point — at least as low risk as it gets in a high-risk market.
What made it a “low-risk” trade was that it was trading right at its stop-loss level. As we mentioned in the post, “A decisive close below 8500 would stop us out.” Indeed, the price of bitcoin would slash through the 8500 level a few days later. As we mentioned in that day’s DSS video, we would bail out on the trade — and look for a better opportunity to get back in. And we had our levels in mind for getting back in, should the opportunity present itself.
From the previous post, we said that “we would not rule out a retest down in the low 7000’s range — or even an overshoot into the mid-6000’s.” We are getting that test now.
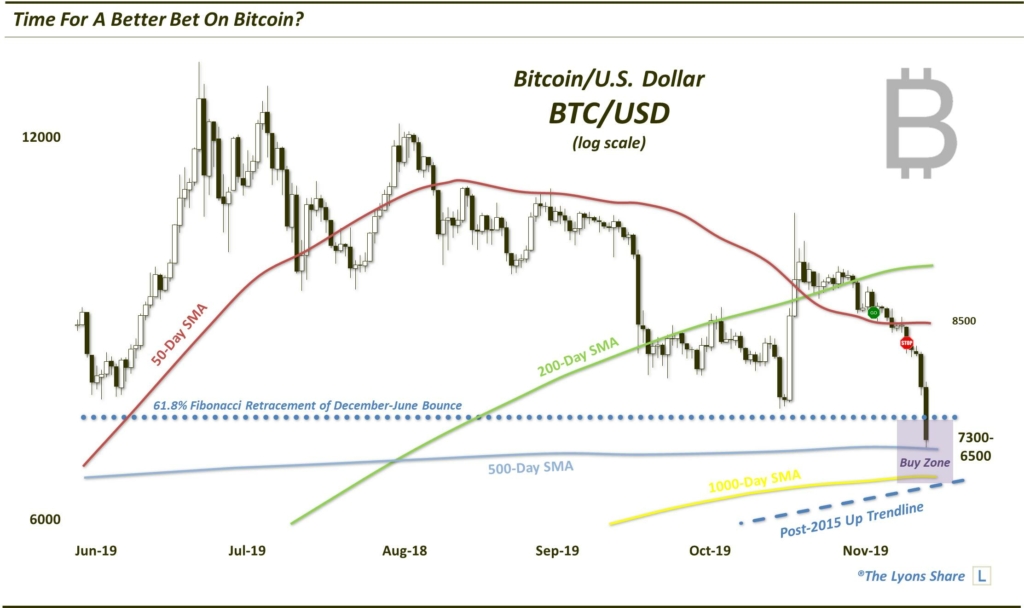
As the chart indicates, the ~7300 level represents the approximate 61.8% Fibonacci Retracement of bitcoin’s December-June bounce. It is also precisely where the initial post-June pullback stopped in October. As we have said in many DSS videos, we would not be surprised with a re-test of that low. This morning, we are getting that re-test — and more.
We have also been saying that, perhaps even better than a re-test at that 7300 spot would be a brief undercut of the low which could clear out a bevy of stops — and then a recovery and rebound from there. That undercut is in motion this morning as well, with a low down toward ~6800. What makes us think that this undercut will eventually produce a rebound instead of leading to a crash? There is still considerable potential support near these levels.
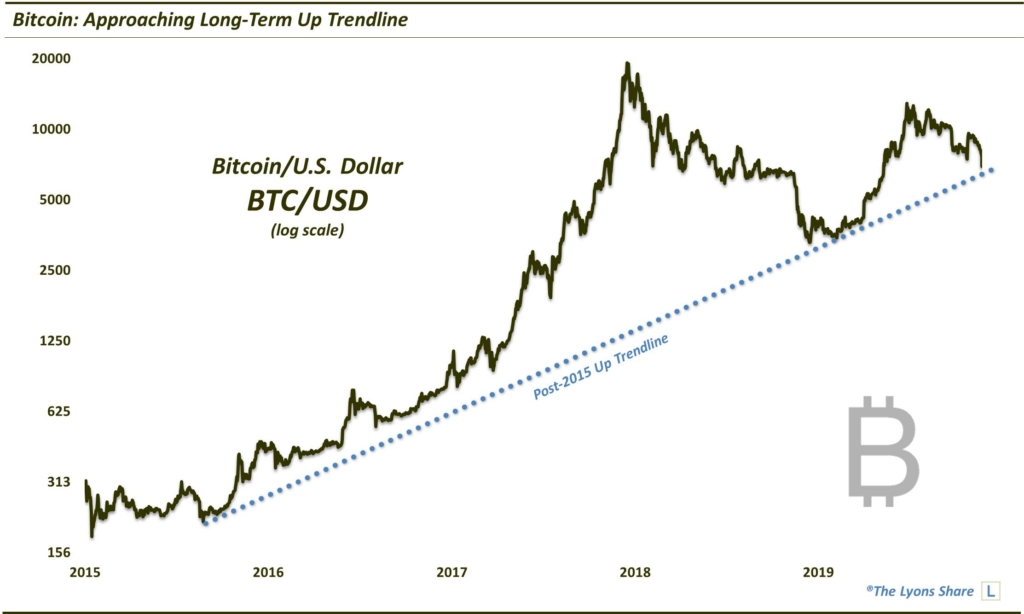
For starters, both the 500 and 1000-day moving averages are lined up between ~6500 and ~6900. Additionally, a major Up trendline stemming from bitcoin’s key 2015 lows and connecting the early 2019 lows is currently intersecting near the ~6500 level.
Thus, in our view, this undercut could be a classic re-test of the October low that washes out the stops and weak hands before rebounding and heading back up. As we have said, it could be only a near-term bounce — or it could lead to another major long-term bull market. Either way, the prospects look attractive from a risk/reward standpoint for another long trade nearby (~6500-7300) in bitcoin. As always in this speculative market, a stop loss should be set in place beforehand. We would stop out on a decisive close below 6500.
Stay tuned to the DSS videos for further updates as things develop.
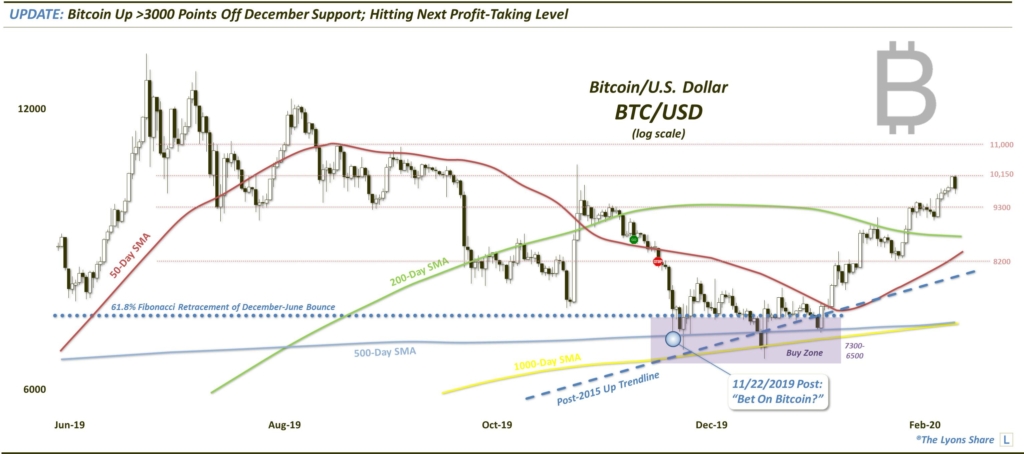
**UPDATED CHART (2/10/2020)**
If you’d like to see these charts as they come out in real-time, follow us on Twitter and StockTwits. And if you’re interested in the daily “all-access” version of all our charts and research, please check out our site, The Lyons Share. You can follow our investment process and posture every day — including insights into what we’re looking to buy and sell and when. Thanks for reading!
_____________
Disclaimer: JLFMI’s actual investment decisions are based on our proprietary models. The conclusions based on the study in this letter may or may not be consistent with JLFMI’s actual investment posture at any given time. Additionally, the commentary provided here is for informational purposes only and should not be taken as a recommendation to invest in any specific securities or according to any specific methodologies. Proper due diligence should be performed before investing in any investment vehicle. There is a risk of loss involved in all investments.