Stock Volatility In Sight
*The following Premium Post was issued to TLS members on October 23, 2020.*
The volatility market is flashing a rare and specific signal.
33 years ago this week, the U.S. stock market experienced the single largest volatility event in its history — the Crash of 1987 (read a personal account of the crash by JLFMI president, John Lyons). The Crash of ’87 not only saw the biggest 1-day loss in stock market history, it also saw the biggest spike in the history of the volatility market. Fast forward to today and we see that, while the behavior of the VIX (S&P 500 Volatility Index) does not remotely bear resemblance to 1987, it is sending what we believe is an important message about forthcoming market action.
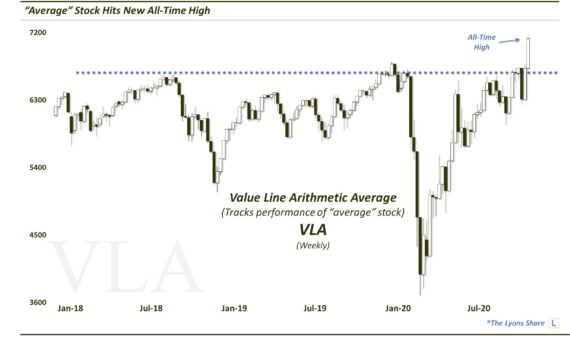
We’ve spoken throughout this year’s post-COVID Crash rally about the stubbornness of the volatility market. Specifically, despite the historic rebound off of the crash lows, including new all-time highs in several popular indices, stock volatility indices have been reluctant to retreat. In fact, volatility indices on each of the Russell 2000 (RVX), Nasdaq 100 (VXN) and S&P 500 (VIX) have yet to break key support levels that we have ear-marked all summer and fall. This buoyancy in the volatility market has been one of the main reasons why we have continually said it is unlikely that the stock market is ready yet to embark on a sustainable new rally.
But while that general buoyant action in the VIX, et al., has signaled caution all year for us, there is another VIX-related signal specifically that we are focused on presently. Recent readings in the volatility market have been particularly elevated, especially relative to the strong behavior in stocks. This was true even prior to the mini-pullback over the past week or so. The interesting thing, however, is that the readings have been inordinately elevated over one duration of the the S&P 500 Volatility market — the 1-month duration, i.e., the VIX.
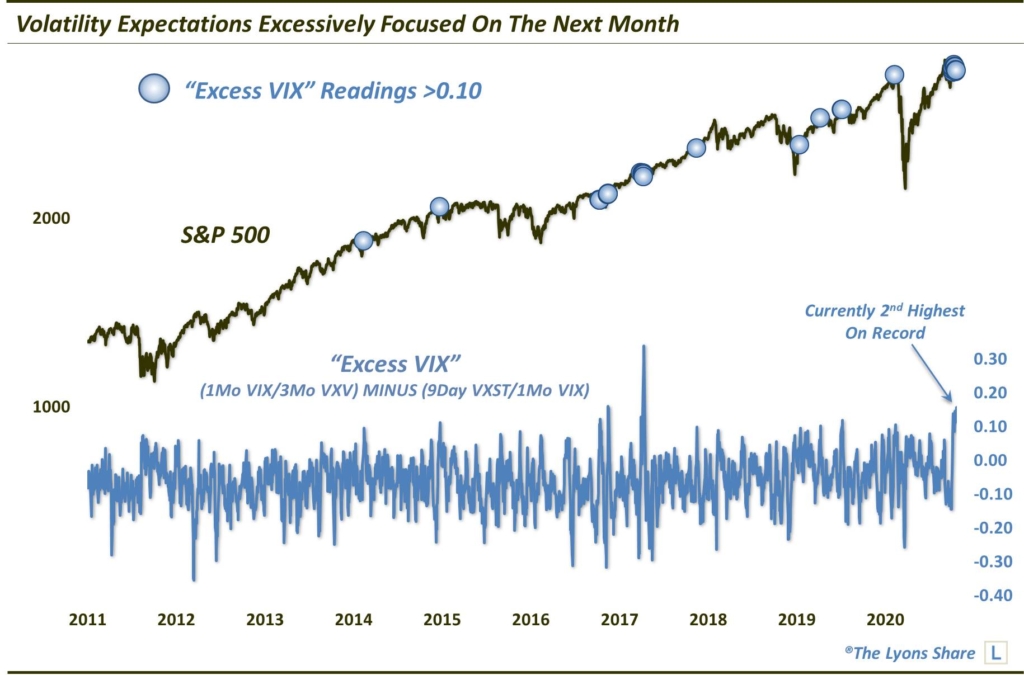
We’ve written many times in the past about the “term structure”, or the different durations over which the various indices of the volatility market cover. For example, the VXST covers volatility expectations over the next 9 days, the VXV over the next 3 months and, again, the VIX over the following 1 month. Over the past few weeks, much of the elevated volatility expectations have been focused on that 1 month duration. We can see that in the study we conducted below, calculating what we have termed “excess VIX”.
We get an excess VIX reading by first dividing the 1-month VIX by the 3-month VXV, i.e., a high number equates to elevated VIX levels. Next, we divide the 9-day VXST by the 1-month VIX, i.e., a small number equates to elevated VIX levels. Lastly, we subtract the latter from the former, giving us the “excess VIX” number. As of yesterday, the excess VIX reading was 0.16. For context, that is the 2nd highest reading in the history of the figure, as this chart reveals.
So why has so much of the volatility action recently been focused on the 1-month duration as opposed to the very short-term or the longer-term? I think it’s pretty clear that there is a specific event within that time frame that traders have their sights on. And unless you live under a rock (and probably still even then), you know that event is the U.S. presidential election. As validation of this theory, keep an eye on this calculation over the next few days as the election date comes into the 9-day VXST window. This excess VIX figure should begin to deflate.
OK, so how does this signal help us? Well, the contrarian in us would certainly consider that when so many investors are leaning in one direction, we can expect the opposite reaction. However, we have observed — and quantified — enough historical data to understand that the volatility market is often correct, at least in the near-term. What about in our present case of extreme excess VIX? Well, let’s go to the historical data.
In the chart above, you can see that we have marked all instances, since the inception of the VXST, of excess VIX readings of at least 0.10. There have been exactly 30 such days since 2011, including a full 10 just in the past 2 weeks alone. In general, they have occurred in 10 unique clusters (one such cluster, btw, occurred similarly around the 2016 election). And, as ominously displayed on the chart, the most recent occurrence took place in mid-February of this year. Gulp. Well, as scary as that may sound, the action in the S&P 500 following that signal was the exception to the rule, historically, rather than the norm.
Here is the performance of the S&P 500 following all of the prior readings of at least 0.10 in excess VIX.
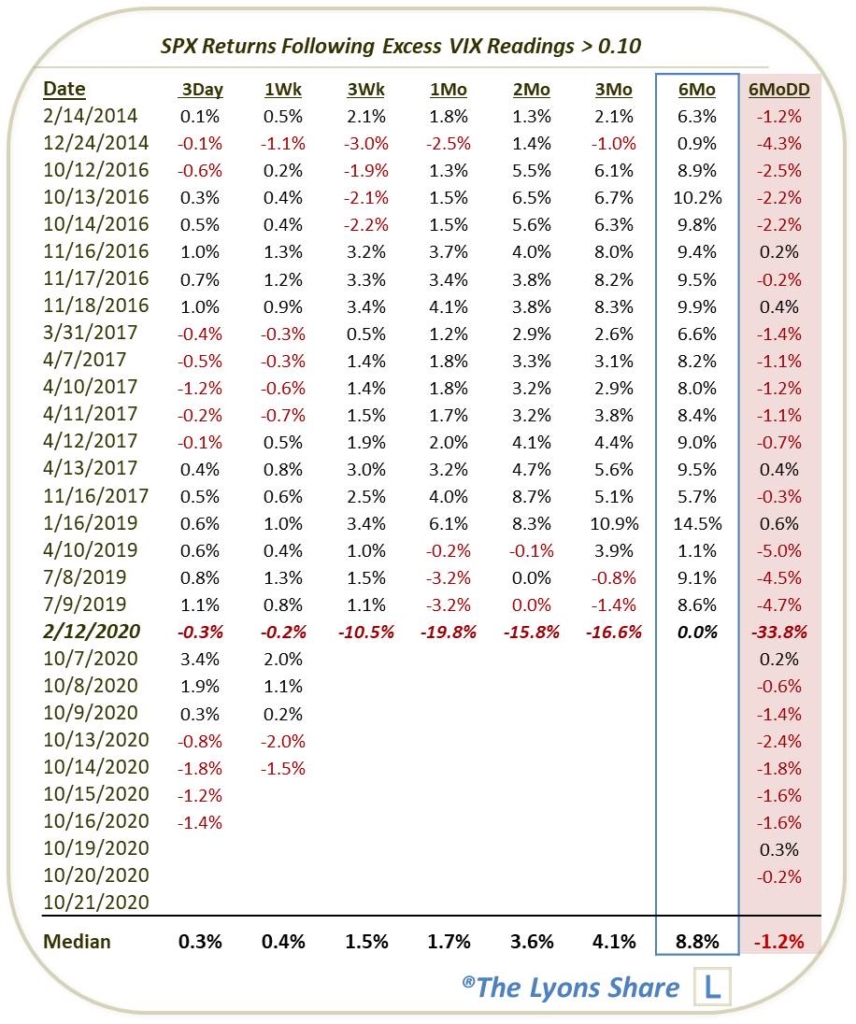
As mentioned, it is not unusual for volatility traders to be rewarded in the near-term for their elevated volatility bets. Indeed, of the 20 occurrences prior to this month, just 4 failed to show a drawdown. Past that, however, the story here looks to be mostly good news.
In terms of 6-month drawdowns, besides the -33.8% crash following February’s reading, none of the historical precedents saw more than a 5% loss at any time over the subsequent 6 months. Moreover, the median 6-month drawdown was a mere -1.2%. And the return data is just encouraging.
Following a bit of near-term turbulence over the next few weeks to month, returns have been overwhelmingly positive. Besides the February 2020 reading, just 2 occurrences saw negative returns over the next 2 months, and just 3 over 3 months. And looking at the 6-month returns, the S&P 500 was positive a full 20 out of 20 times,
What’s the takeaway? Traders are betting on increased volatility in the near-term. And while they may very well get it, excess volatility expectations are pretty unique to the 1-month duration. This is most likely mainly due to the election. Therefore, once we move beyond the election (at least once we have resolution to the election), volatility buoyancy should begin to dissolve. At that point, the market will stand a better chance of staging a new sustainable up-leg.
As always, stay tuned to our DSS posts for further developments — they provide the most current updates to our investment portfolio and outlook.
If you’re interested in the “all-access” version of our charts and research, we invite you to check out our new site, The Lyons Share. TLS is currently running a 30th anniversary 1987 Crash Commemoration SALE, offering a discount of 22.6%, or the equivalent of the Dow’s 1-day drop 30 years ago. The SALE ends October 25 so considering the discounted cost and a potentially volatile market climate, there has never been a better time to reap the benefits of our risk-managed approach. Thanks for reading!
_____________
Disclaimer: JLFMI’s actual investment decisions are based on our proprietary models. The conclusions based on the study in this letter may or may not be consistent with JLFMI’s actual investment posture at any given time. Additionally, the commentary provided here is for informational purposes only and should not be taken as a recommendation to invest in any specific securities or according to any specific methodologies. Proper due diligence should be performed before investing in any investment vehicle. There is a risk of loss involved in all investments.