ChOTD-4/11/14 Relative Inverse ETF Volume Not Yet At Fear Levels
A great thing about investment innovation is the supply of new metrics with which to measure market conditions. One of our favorite new indicators, particularly during a pullback, is what we call Relative Inverse ETF Volume. It is exactly what the name implies: the percentage of volume traded in inverse ETF’s vs. total market volume. (The example displayed here is a proprietary indicator and is not inclusive of all inverse ETF’s.)
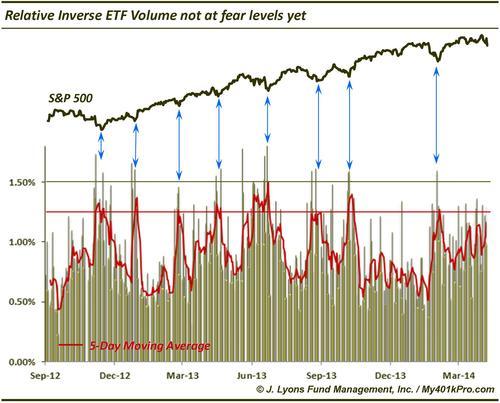
Each S&P 500 decline since September 2012 has seen at least 1 day of our Relative Inverse ETF Volume indicator reach 1.5% and the 5-day moving average reach 1.25%. Neither of these has occurred yet in the current decline. This suggests a lack of sufficient “fear” in the market to satisfy an intermediate-term bottom, at least according to recent precedent.