A Curious Spike In Inverse ETF Volume

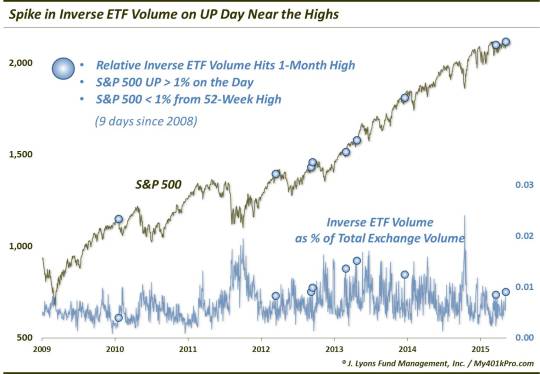
One of our favorite new short-term sentiment gauges in recent years has been relative inverse ETF volume. This indicator measures the amount of volume traded in “inverse ETF’s” (those that are designed to move in the opposite direction from the market) relative to the total stock volume traded on the exchanges. The idea behind the indicator, which we first saw utilized by Jason Goepfert at Sentimentrader.com, is that elevated relative volume in inverse ETF’s is an indication of heightened fear on the part of investors (or traders). Conversely, very low levels of inverse ETF volume indicate complacency. As with most sentiment-type indicators, it has typically been in one’s best interest to fade (i.e., trade in the opposite direction from) the extremes in sentiment. Friday saw an interesting reading in this indicator, however, the interpretation of which is not so straightforward.
As mentioned, high levels of inverse ETF volume have been a sign of elevated fear. These readings have typically come after sharp or prolonged periods of weakness in the market. Friday was an exception, however. Despite a rally of over 1% in the S&P 500 on the day, and despite closing very near a 52-week high, relative inverse ETF volume hit a 3-month high on Friday. This has been a rare occurrence for this indicator since the explosion in ETF popularity around 2008. In fact, based on our proprietary version of this indicator, it has only happened on 1 other occasion, April 23, 2013. If we relax the parameters a bit to include days when relative inverse ETF volume merely reached a 1-month high, despite a 1% S&P 500 rally to within 1% of a 52-week high, we get a total of 9 days since 2008.
Here are the dates of these atypical jumps in inverse ETF volume:
- 1/19/2010
- 3/13/2012
- 9/6/2012
- 9/13/2012
- 2/27/2013
- 4/23/2013
- 12/18/2013
- 3/18/2015
- 5/8/2015
So what accounts for the rise in inverse ETF trading in the face of the positive market action? Well, it has not been unusual to see a short-term cycle peak in inverse ETF volume occur on a big up day immediately following significant weakness (i.e., the first big rally day off of a low). This makes sense as a combination of short-covering as well as fearful traders shorting into strength can result in such a spike. However, as mentioned, this is typically after significant weakness, not a 2-day pullback of less than 2%.
A good way to parse the data in that regard is to identify those occurrences taking place near a 52-week high in the market like we have done. Thus, the resulting 9 spikes in inverse ETF volume are truly unique, having occurred on big up days near a 52-week high in the S&P 500. One common thread among most of these occurrences is that there was very little in the way of market adversity over the prior month. Because of that, inverse ETF volume, overall, was pretty low. Therefore, it was an easier bar to surpass in reaching a 1-month high, despite the unusual fact of it occurring on a large up day. That is our best explanation of the phenomenon. And the fact that inverse ETF volume hit a 3-month high is probably testament to the recent historically range-bound environment that we have been discussing.
So you’re probably wondering what happened in the aftermath of the prior occurrences. Unlike many of the studies we’ve done, this one does not really have an overarching theme to the results (that is, afterall, why we present the studies that we do). This phenomenon has been a tale of 2 market regimes, pre-2013 and post-2013. Something certainly changed when the calendar hit 2013.
The market has acted differently since then, for whatever reason.
We’ve seen it in other studies and we see it here. Witness the differing returns before and after January 1, 2013.
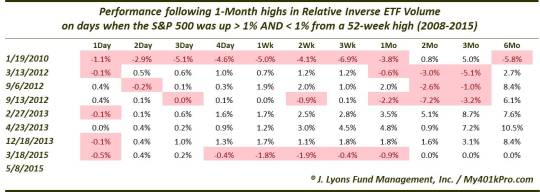
The 4 occurrences from 2010-2012 resulted in decent-sized drawdowns in the intermediate-term. 3 of the 4 saw the S&P 500 down from 1 month to 3 months afterward. And the only occurrence in the entire sample that saw a negative 6-month return was the first one, in January 2010. So somewhat surprisingly, the jump in inverse ETF volume among the pre-2013 occurrences was actually a decent indicator of impending intermediate-term weakness.
Meanwhile, before the previous occurrence in March of this year, none of the occurrences since the beginning of 2013 saw any losing periods beyond 1 day. Those other 3 all occurred in the year 2013. Incidentally, the April 2013 occurrence – the only other instance besides Friday when relative inverse ETF volume hit a 3-month high – was the only one that showed no losing periods across those listed in the table here. Needless to say, since the beginning of 2013, these conditions have not led to anything remotely concerning.
So what is the ultimate takeaway? It is unusual to see inverse ETF volume spike on an up day and near 52-week highs. The recent range-bound trade has made it easier, however, for the indicator to reach a 1-month high. As far as the ramifications going forward, it is difficult to make a decisive conclusion. Before 2013, it led to intermediate-term weakness all 4 times. Since then, however, the market has gone straight up afterward, except for the prior occurrence this past March. Does that mean the post-2013 straight up market regime is finally peetering out? It is too early to say, but the market’s performance in the aftermath of Friday’s development may give us a clue regarding that question.
_____________
Monkey photo by funnymonkeysite.com.
More from Dana Lyons, JLFMI and My401kPro.
The commentary included in this blog is provided for informational purposes only. It does not constitute a recommendation to invest in any specific investment product or service. Proper due diligence should be performed before investing in any investment vehicle. There is a risk of loss involved in all investments.