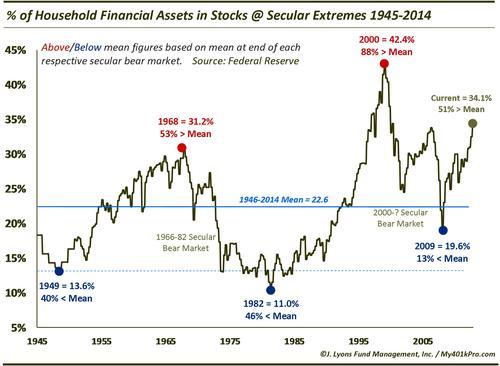
ChOTD-4/25/14 % of Household Financial Assets In Stocks @ Secular Market Extremes 1945-2014
An excerpt from our May Newsletter “2014 Secular, Ahem, Bear Market Update”:
Investment Behavior
As discussed, secular bull markets end in a condition of relative investor euphoria. They don’t always end in a bubble (e.g., 1929, 2000 Nasdaq) but they do always end with a measurable extreme in bullish behavior on the part of investors. One of our favorite measures, simply because the series goes back longer than most data pertaining to investor behavior, is the percentage of households’ financial assets that are invested in stocks. As we have shown many times, households (like most investor groups) are least invested at the beginning of secular bull markets and most heavily invested at the end. This is not surprising as the imbalance reaches a point where there are relatively few buyers left at the top and few people left to sell at the bottom.
Unfortunately the data (from the Federal Reserve) does not extend back to the beginning of the 1929-49 secular bear market as it would be interesting to know the level of household investment at the euphoric 1929 top. However, at the end of the bear in 1949, households had less than 14% of their assets in stocks, a reading 40% below the long-term mean. By the end of the 1949-66 bull market, household investment had more than doubled, reaching as high as 31.2%, or 53% above the mean. As the 1966-82 secular bear unfolded, investors gradually pulled their money out of stocks again until they were left with just 11% of their assets in the market, or 46% below the long-term mean. Predictably, this was exactly at the beginning of the massive 1982-00 secular bull. It is interesting to note, as we have many times, that the low in stock prices during the 1966-82 bear actually occurred in 1974 yet household investment continued to decline until 1982. This reflects the psychological impact of the latter stages of a secular bear wherein investors simply get frustrated by the inability of stocks to make any upward progress that they eventually lose trust in the asset class.
So what about the current cycle? At the top in 2000, households had a staggering 42.5% of their financial assets in stocks, 37% higher than the previous record high in 1968 and 88% above the long-term mean. Newton’s law demands an equal reaction to this extreme, i.e., an extreme low level of household investment, before the secular bear market is finished. This has yet to occur. At the lows in 2009, household stock investment fell to about 20% of assets. While down 50% from the 2000 high is certainly an improvement, at 13% below the mean, it is hardly an equal and opposite reaction. And on an absolute basis, we would expect the level to approach the 1949 and 1982 levels in the low teens before considering it to be an equal reaction to the 2000 upside extreme. At those levels, a new sustainable secular bull market could be supported.

