Household Stock Investment Is At 2007 Levels

From today’s quarterly Z.1 release from the Federal Reserve Board comes one of our favorite statistics: “Households and nonprofit organizations; directly and indirectly held corporate equities as a percentage of total financial assets”. It’s a mouthful, but it’s essentially the percentage of investable assets that households currently have in stocks. To us, it is an interesting statistic because its behavior throughout the decades informs us a lot about not only investment behavior but also investor psychology. Currently, it is interesting because households have 34.7% of their financial assets in stocks – the exact same level as at the peak in 2007.
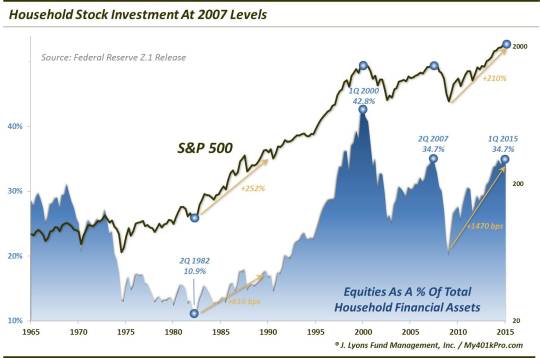
Household stock investment is an example of an investment metric that we refer to as a “background indicator”. These indicators describe the condition in the marketplace, but are not catalysts themselves. Thus, we consider them to be measures of potential risk should a catalyst come along to trigger a decline. It is true that household stock investment has been at these elevated levels for a couple quarters now so this isn’t exactly breaking news. However, considering we are at the highest level of household stock investment ever outside of the 1998-2000 period, it is still worth noting, in our view. It strikes us that perhaps folks have become dulled to the extreme levels of stock investment. If that is the case, such complacency could be a potential source of growing risk.
That said, plenty of folks have made the case that household stock investment should actually be higher. Frankly, we are more surprised that it is as high as it is. A couple observations on both sides:
Is Household Stock Investment Too Low?
The obvious argument for household stock investment being too low is simple market price appreciation. While stock investment is the exact same – 34.7% – as it was at the market peak in the 2nd quarter of 2007, the S&P 500 is 38% higher than it was then. Therefore, all things being equal (that’s the key), stock investment should be higher than in 2007. That is, as long as every other financial investment is not up even more (they aren’t).
So why isn’t household stock investment higher now? 2 words: human nature. Investors buy the most near market peaks and sell the most near market bottoms. Even self-proclaimed “buy-&-holders” have a difficult time following through with that strategy when the going gets tough. One need only look at the market cycle since 2000 to observe that phenomenon in practice. Why was household stock investment lower in 2007 than at the all-time high peak in 2000? Because investors bought a lot of stock in 1999 and 2000 and sold a lot in 2002 and 2003. Therefore, they made back much less in the 2003-2007 rally than they lost in the preceding decline.
Conversely, why was the 2009 trough in stock investment much lower than the 2002-2003 trough when the S&P 500 was roughly the same level at the lows (on a quarterly closing basis)? The same reason: investors bought a lot of stock in 2007 and, thus, with a higher average investment cost, lost more money in the 2007-2009 decline than they made in the preceding bull market. It’s the same story now. So many investors bailed out at the lows in 2008-2009 that it took a 35% rise above the previous S&P 500 peak before their stock investment was back at the same level.
Another reason for considering that household stock investment should be even higher is competition. That is, competition for those investment dollars. It is a zero-sum game here so the better the competition among other asset classes, the lower the investment to stocks, presumably. And based on that rationale, there was significantly stronger competition for investment dollars back in 2007 than there is now, despite all the QE, etc. First, real estate is not included in the “financial” assets in the data series’ calculation. However, REITS and real estate funds and the like are. And while it is true that the real estate bubble had already popped, it was still fairly early on in mid-2007. Thus there was still significant competition from real estate for investment dollars that may otherwise go into stocks. At least, most real estate bubble buyers had yet to cover their losses. Therefore, as a percentage, stock investment should be higher now versus real estate than it was back then.
In terms of fixed income, there are a few cross-currents to consider. First, in terms of cash, there was no competition. One could get about 4% on a money market in 2007 versus vapor today. The competitive equation should be a no-brainer, right? Well, fortunately, investors demonstrated slightly higher levels of cash investment in 2007 than is the case today. One would have hoped that it would be a bit more lop-sided than it is, but at least the infinitely less competitive cash situation today has pulled slightly fewer dollars away from stocks than in 2007.
Regarding longer-dated fixed income, it’s a different story. For example, at the end of the 2nd quarter in 2007, the 30-year yield was 5.12%. At the end of March, it was 2.54%. With yields twice as high in 2007, objectively, more investment dollars should have been allocated to bonds then than in our present-day situation. That isn’t the case. Despite much less competitive yields, allocation to bonds are, by some measure, as much as 50% higher now than in 2007. So this asset class which should be pulling fewer investment dollars from stocks is actually pulling more. Why? The answer again is almost certainly human nature. Investors chase returns in all markets, not just stocks. That includes bonds. And after a massive rally to all-time low yields, investors have chased bonds as well – despite all-time low yields. This is another clear example of human nature directing investment flows.
Finally, consider the other major asset class: commodities. In 2007, commodities were in the midst of an intermediate-term bear market. However, the real story was that they were sandwiched between a 5-year 100% rally from 2001-2006 and a forthcoming parabolic move that would take the major commodity indexes up some 60% into the middle of 2008. Therefore, the competition was also much better from commodities in 2007 than is the case now. So despite an investment landscape that is much less competitive on most fronts, stock investment has only been able to match levels of 2007. Why is that? Our guess is that it is a stealth manifestation of investors’ human natural aversion to stocks as a result of the prior bear markets. Even though the absolute level of investment is historically elevated again, relative to other assets, it arguably should even be much higher.
Is Household Investment Too High?
Given a stock market that has well surpassed its previous peak, and a much less competitive environment for investment dollars, how can household stock investment possibly be considered too high? One argument – ours – is based, again, on human nature as well as the secular market cycle. As readers may be aware, our belief is that the U.S. stock market has likely not yet emerged from the post-2000 secular bear market – despite the higher highs (note: while this thesis has significant long-term implications, it has no bearing on our intermediate-term investing models). A secular bull market is characterized by various investment metrics moving to levels of excess at its culmination. Such excesses must then be “worked off” during the subsequent secular bear market before a new bull can begin. We have not seen these excesses adequately repaired yet, in our view. Furthermore, on many occasions, the metrics will go to levels of extreme in the opposite direction before the secular bear market is finished.
Take this measure of household stock investment, for example. Look at the secular bear market from 1966 to 1982. Stocks constituted a then-record high of 31.1% of households’ financial assets near the onset of the bear market. By the end of the secular bear in 1982, that percentage had fallen to an all-time low of just 10.9%. This was the epitome of the human natural aspect of investing. Despite the fact that the market was actually higher in 1982 than at other lows during the bear market, household investment was at a low. The repeated declines throughout the 16 years wore on investors until they almost shunned the stock market entirely. It was also a textbook example of the secular bear market dynamic wringing out the market’s excess. Only then was a sustainable secular bull market able to be launched.
During the post-2000 secular bear, the lowest level of household stock investment was 20% in the 1st quarter of 2009. While that was well down from the all-time high of 42.8% in 2000, it was just barely below the mean reading of 22.3% since the data began in 1945. In fact, it was the only quarter during the entire bear market that was below the all-time mean. That, to us, hardly constitutes an adequately repair of the excesses. Now, it is entirely possible that there is a structurally higher level of household investment now than in 1982. However, the 2009 low in stock investment essentially only worked off the late bull market buildup of household stock investment, bringing the level back down to that of the early 1990′s.
Speaking of the early 1990′s, another clue that perhaps the secular bear market has not yet run its course lies in the investment behavior of households over the past 6 years versus that of the early part of the post-1982 secular bull market. Note on the chart how during the substantial market gains in the early stages of the 1982-2000 bull market, household stock investment was very slow to rise. In fact, by the 2nd quarter of 1990 – 8 full years into the bull market – stock investment had only risen to 17%. That was a rise of a mere 610 basis points from the low in 1982, despite the fact that the S&P 500 had risen more than 250% during that time.
Contrast that with the behavior of the past 6 years. Despite all of the quips about “the most hated rally of all time”, households were relatively quick to jump aboard following 2009. Note that I say relatively quick. Many investors bailed out near the lows in 2009 and were forced to chase the market higher after it rebounded. Still many others sat on the sidelines for years before getting back in. And no doubt there are others that never even got back in, or at least not substantially. However, compared with the first 8 years of the post-1982 secular bull market, the rise in household investment has been swift. Consider the fact that while the S&P 500 has made similar gains
since 2009 (+210%)
as that 1982-1990 period, household investment has risen by 1,470 basis points (20% to 34.7%). Again, contrast that with the 610 bps gain from 1982-1990. During the initial stages of a secular bull market, we do not expect to see such behavior. Therefore, our belief is that the odds are very good that we are not done with the secular bear market.
What’s the Cliff’s Notes version? Stocks as a % of household’ financial assets are at a level where they peaked along with stocks in 2007. An argument can be made for a structurally higher level of household stock investment. Additionally, a less competitive climate among other asset classes should make stock investment more attractive. However, our view is that household stock investment is at an elevated level on an absolute basis, which represents considerable potential risk. Furthermore, household investment has never dropped to levels that adequately repaired the condition of excess that began the post-2000 secular bear market. And, unlike the investment behavior during the onset of the prior secular bull market, households have been relatively quick to add stock investment. This suggests to us a high probability that the post-2000 secular bear market has not yet run its course.
________
More from Dana Lyons, JLFMI and My401kPro.
The commentary included in this blog is provided for informational purposes only. It does not constitute a recommendation to invest in any specific investment product or service. Proper due diligence should be performed before investing in any investment vehicle. There is a risk of loss involved in all investments.


