ChOTD-5/13/14 Russia RTS Index Bounces @ Key Long-Term & Short-Term Fibonacci Levels; Further S/T (& Major L/T?) Potential Ahead
Today we take a break from posting on the plethora of historic divergences in the market for a good old fashion look at a stock chart. Specifically, we’re looking at Russia’s RTS Stock Market Index from both long and short-term views. It may surprise folks that this look actually elicits minor and possibly major positive takeaways. First, the long-term:
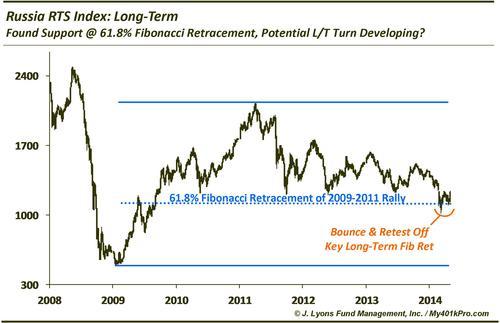
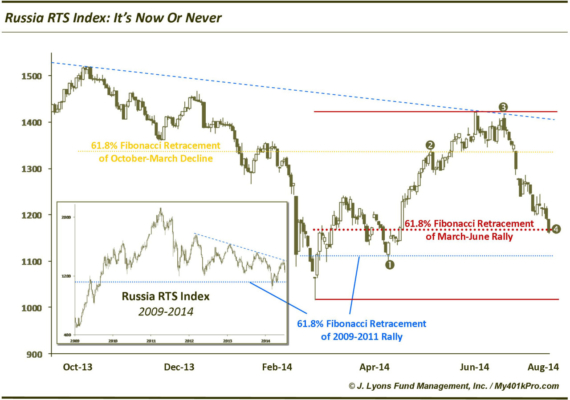
At the onset of the Russian-Crimean military situation in late February-early March, the Russian stock market plummeted. The RTS index broke below the approximate quad-bottom lows registered in 2010, 2011, 2012 & 2013, stoking fears of an all-out crash. While it did fall about 17% below the breakdown area at its worst point, it found support right near the 61.8% Fibonacci retracement of the 2009-2011 rally, forestalling the crash fears. Furthermore, after a brief bounce, the index “re-tested” that key Fibonacci level and again bounced off of it.
We can see this action better on the short-term chart:
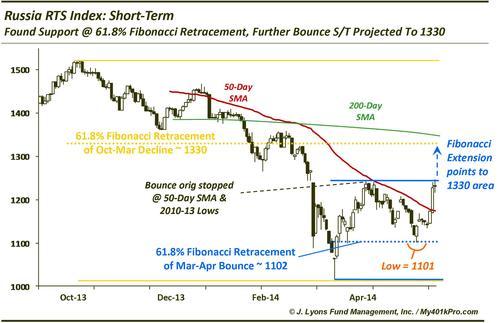
The bounce off the March lows (@ the long-term 61.8% Fib retracement level) stalled roughly at the quad-bottom 2010-13 lows, as well as the 50-day simple moving average. The subsequent pullback (the aforementioned re-test) again stopped “where it should”, within a point of the 61.8% Fib retracement of the March-April bounce at 1101. It has since responded positively to that level by bouncing through the 50-Day SMA back to the April highs. This positive action suggests the bounce should continue, with the next destination being roughly 1330. This level represents various key points, including: the 161.8% Fibonacci extension of the April-May pullback range, the 61.8% Fib retracement of the 2013-14 decline and the 200-Day SMA.
The importance of the index finding support “where it should” is the suggestion of orderly market behavior.The Russian market didn’t succumb to an out-of-control crash; rather, it did what it was “supposed to do”. As such, we can reasonably expect that it will continue to do what it’s “supposed to do” based on chart patterns and levels. This suggests a move, in the short-term, of about 7-8% to around 1330. Long-term, while it obviously remains to be seen, considering the bounce occurred where it should, a major turning point cannot be dismissed. As long as the index holds the 1100 level, a resumption of the secular bull market that began in 1998, along with new highs, is not out of the question…eventually.