Updates & Accountability Check

It seems to be the case on financial social media — and perhaps media in general — that the half-life of a post, tweet, story, etc. gets shorter and shorter by the day. With the exponential influx of information, a post can seem obsolete, or at least forgotten, overnight (save for that astute reader who waits months for your “idea” to turn south so he can remind you of it). A minute is like a day and a day like a year in this realm.
With that in mind, we thought it was appropriate to review posts from the past month and update any active studies that are ongoing and any investment/trading “calls” that we posted. (If a post is not updated here, it is either more than a month old or of a very long-term or abstract nature not relevant for immediate review).
______________________________________________________
Active Studies
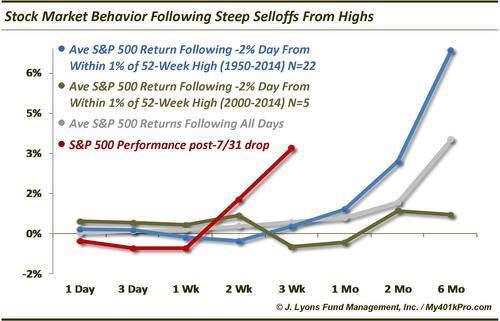
What To Expect After A Sharp Selloff From 52-Week Highs (8/1)
Inspired by the July 31 sell off, this study noted the tendency for stocks to languish temporarily after such a decline before resuming their out-performance in forthcoming months. The caveat was that instances since 2000 showed the reverse: near-term out-performance before subdued returns over subsequent months. The current iteration has been a bit of a hybrid of the two. The market continued weak for the next week but has bounced back strongly over the following 2 weeks. It remains to be seen how this transpires, but the market seems to be back in its rally mode from before the brief July-August decline.
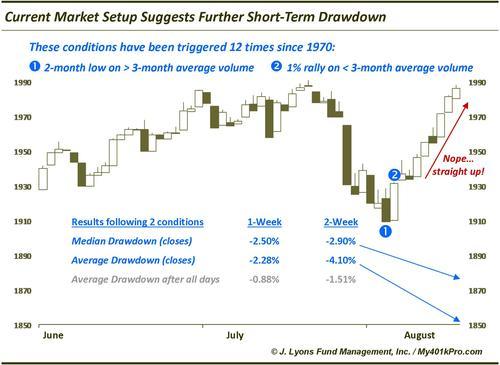
Current setup suggests further short-term stock market weakness (8/11)
This study completely whiffed as, for the first time in history following these conditions, the S&P 500 continued straight up without even a single close below the August 8 close. This market has had a tendency of steamrolling these types of studies over the past 20 months.
______________________________________________________
Investment/Trading “Calls”
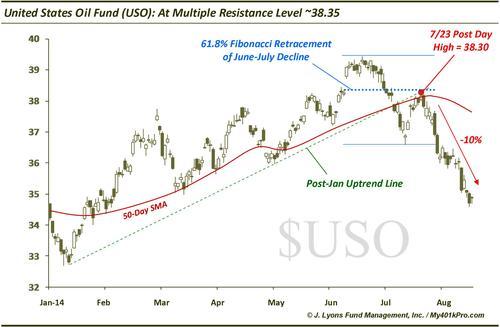
Commodity Spotlight: United States Oil Fund $USO: At Multiple Resistance Level ~38.35 (7/23)
This post was dead nuts. The high on the day of our post was 38.30 and from there, it’s been pretty much straight down to the tune of about 10%. It has tried to hold some support at about 35 but failing that, there is better support around the 33 level.
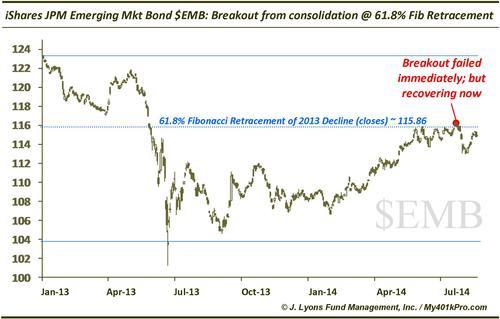
FI Spotlight: iShares JPM Emerging Market Bond $EMB: Breaking out of consolidation at key resistance (7/24)
After bumping up against the 61.8% Fibonacci Retracement of its 2013 sell off 4 times, EMB broke out above the level on July 23. The breakout failed immediately (as so many setups have transpired recently). After selling off sharply for 3 days, EMB has righted itself and is now approaching its highs again. While the breakout failed, we still think there is potential here.
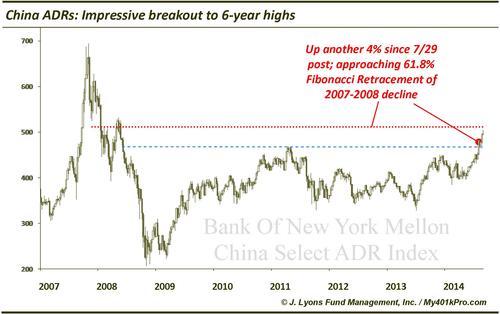
Regional Spotlight: China ADRs Break Out To 6-Year High (7/29)
About a month ago, Chinese ADR’s (represented by the BNYM China Select ADR Index) broke out to a 6-year high. We liked this breakout for a couple reasons. First, it had bumped against the breakout level on a couple occasions spanning 3 years. Thus, a solid base had been formed. After hitting that level late last year, it pulled back before finally breaking through. Technicians might label it a cup-and-handle formation which can be a precursor to a powerful rally. Additionally, the breakout came in the form of the largest weekly gain in 3 years. A move like that usually continues higher in the short-term as traders are skeptical about buying in so “high”. Those hoping for a pullback to buy are left behind as markets rarely accommodate such hope. Indeed, after a brief and tight consolidation, the China ADR Index has moved another 4% higher. It is now approaching the 61.8% Fibonacci Retracement of the 2007-2008 crash which may pose the first serious resistance post-breakout.
Regional Spotlight: Major Upside Potential In Latin America (7/30)
This is a longer-term call. Latin America has consolidated at a key Fibonacci Retracement cluster as suggested in the post, setting up the next potential upleg.
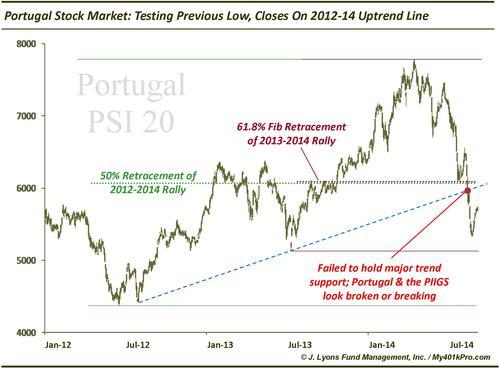
Can Portugal Stocks Spark One Last Hurrah For The PIIGS? (7/31)
This wasn’t a “call” per se, but a recognition of a key support level in the crashing Portuguese PSI 20 Index and its potential influence on the rest of the PIIGS markets. The area was marked by the July low as well as several key Fibonacci levels and the post-2012 uptrend line. The support failed miserably as the PSI 20 sliced right through it, dropping another 12% before bouncing. As we mentioned in a July 21 post, the PIIGS were threatening to break down in relative strength versus the core European bourses. This PSI 20 failure has contributed to the relative breakdown becoming reality.
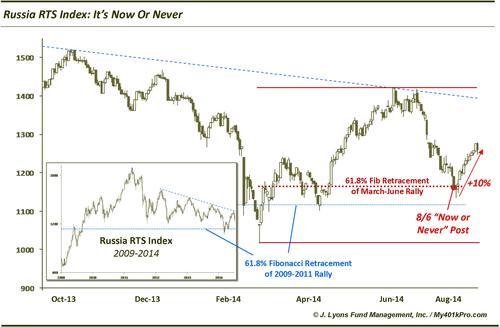
Country Spotlight: It’s now or never for Russian stocks (8/6)
Like the Portuguese post, this one was ultra-contrarian as it came in the midst of the U.S.-led sanctions campaign against Russia and at a time when Russian stocks were in a near-term free fall. Unlike the Portuguese post, we felt this one did merit consideration by traders. We’ve noted several times this year, beginning with a May 13 post, the developments in the Russian market that pointed to at least a short-term bounce and potentially a longer-term bottom. Subsequent action confirmed the short-term potential as the Russian RTS Index rallied about 30% off of a key long-term support level. That said, a longer-term turn following the 2011 to 2014 decline is still in question, especially after the RTS failed in June and July at the post-2011 downtrend line.
Our August 6 post pointed out that while the long-term Russian bottom thesis is on hold, the short-term potential had not been totally negated by the recent weakness. However, the Russian stocks were at a point which we labeled “now or never” at the time. The RTS certainly responded to the “now” option as it bottomed immediately and has rallied 10% in the past 2 weeks. While time will tell whether or not Russia is ready to finally begin a new bull market, it has at a minimum responded positively when it needed to. This episode also emphasizes the importance of identifying the right levels as support/resistance points. They can end up producing the biggest winners, particularly when accompanied by sentiment extremes such as the overwhelming bearishness towards Russia a few weeks ago.
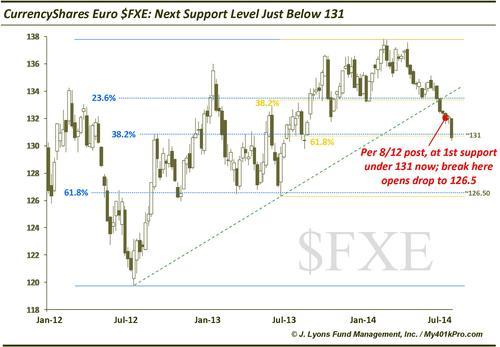
Euro approaching support with dealers holding substantial long positions (8/12)
As mentioned above regarding the Russia post, this is another example of hunting a key support level in a market characterized by extreme bearishness. We pointed out in the post that Commercial Hedgers, or Dealers, were holding an extreme net long position in Euro futures. Dealers are typically considered the “smart money, at least at turning points. At the same time, the Euro (at least as represented by the CurrencyShares Euro ETF, FXE) was approaching support. Almost 2 weeks later, the FXE is at the potential support area we identified just under 131. Dealers in the meantime have only added to their extreme longs during that time. We feel this is a potential bounce candidate due to those factors. Any significant break of this area opens the downside to 126.5.
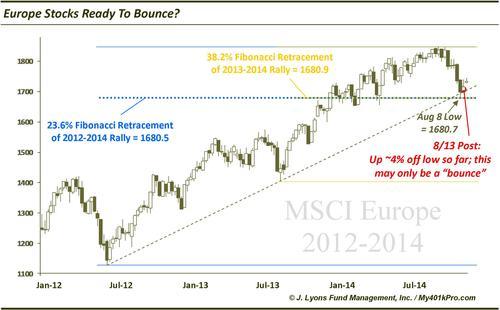
European stocks bounce at precisely the right spot (8/13)
European stocks, as represented by the MSCI Europe Index, bounced precisely at a confluence of 2 important Fibonacci Retracement levels on August 8. They have since added a few more percentage points to their bounce. There may be a bit more to this move; however, we are not confident that this will prove to be anything more than just a bounce of a few weeks.
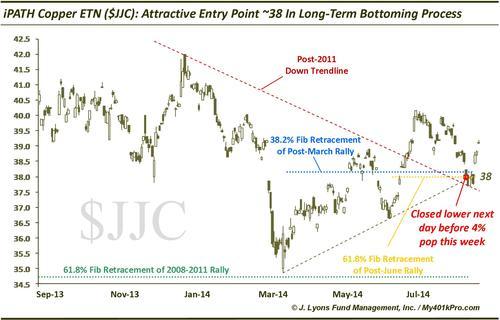
Update: Copper JJC at attractive level within long-term bottoming process (8/13)
Like our Latin America post, we mentioned in July the potential that a longer-term bottom was developing in Copper. Such a significant turn takes time to unfold and won’t be a straight up shot should it be underway. In this August 13 post, we mentioned that a potential attractive entry point in the Copper ETN, JJC, may be emerging within that scenario. Buoyed by the uptrend line since March, the top side of the post-2011 downtrend line that it had already broken above as well as 2 key Fibonacci support levels, the roughly 38 level looked to offer substantial support. After slightly breaching the 38 area the following day, JJC jumped about 4% last week. There is still work to be done in the long-term here, but again, this market is at least responding where it "should” and that is a positive.
High yield bonds: the bear battle begins (8/15)
High yield bonds rallied a bit early last week before giving back some of their gains on Friday. This battle is just beginning.
____________________________________________________
More from Dana Lyons, JLFMI and My401kPro can be found here.
Bullseye photo by Bogdan Suditu.


