
Risk Managers Throw Caution To The Wind
One survey of active managers reveals an average allocation of over 100% to equities currently.
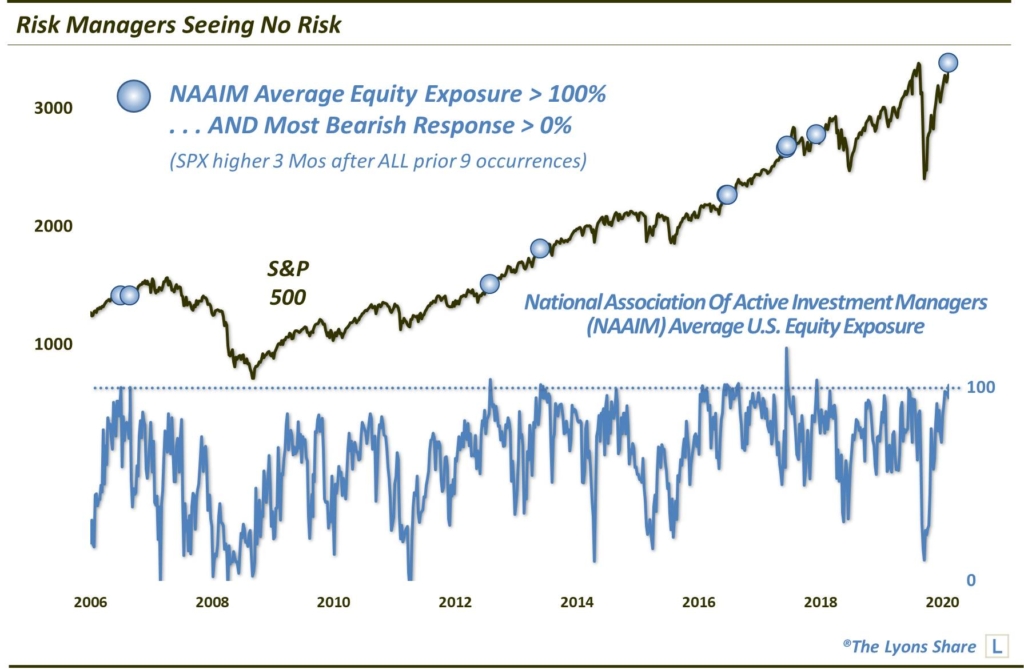
Given the ramp up in stocks, it’s no surprise that we are seeing a concomitant rise in investor bullishness. This even includes one group of managers known for their risk-conscious management style. The National Association of Active Investment Managers, or NAAIM, is made up of Registered Investment Advisors and other money managers who employ active or tactical investment strategies as opposed to buy-&-hold and passive asset allocation. For the most part, the goal of such strategies is to reduce investment risk by applying processes to mitigate losses when they view markets as high-risk. Apparently, this group sees very little risk in the market at this time. That conclusion is based on the latest reading of the weekly NAAIM Exposure Index, a survey of the group’s collective equity allocation.
We make that assertion based on the fact that, as of this week, these active managers have an average of over 100% exposure to the stock market. That means that the average manager is presently leveraged long in the stock market. That marks the 15th such reading in the survey’s 14-year history. It is also the 10th week with a reading over 100% in which even the most bearish response in the survey was greater than 0%.
Of course, the natural inclination is to think that, from a contrarian perspective, this show of extreme collective bullishness must be troublesome for stocks. However, from strictly a historical perspective, the contrarian “warning signal” based on bullish sentiment extremes in the Exposure Index is far from clear-cut — particularly in the intermediate-term. So before you go and sell all of your equities, consider the track record of the survey’s historical extreme bullish readings.
Specifically, let’s look at the performance of the S&P 500 following those prior 9 weeks with A) readings of over 100% average equity exposure, and B) a “most bearish” allocation response of over 0%.
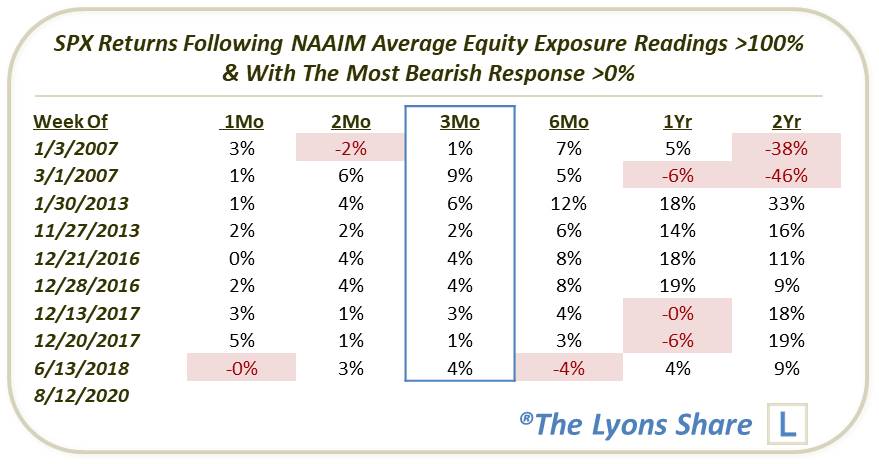
As you can see, while there was at times trouble in the longer-term (e.g., 2007, 2018), the S&P 500 was higher 3 months later all 9 previous times. Hardly a contrarian “sell signal”.
What’s the takeaway? While historical precedents do not necessarily bear it out statistically, we would rather see skeptical sentiment from most any group, rather than consensus bullish readings. But while we would not necessarily categorize this data point as a buy signal, I think we can definitively say that an Equity Exposure reading this high is not necessarily a death knell for the rally by any means.
How much “stock” are we putting into this data point? How is it impacting out investment posture? If you’re interested in an “all-access” pass to all of our charts, research — and investment moves — please check out our site, The Lyons Share. You can follow our investment process and posture every day — including insights into what we’re looking to buy and sell and when. Thanks for reading!
_____________
Disclaimer: JLFMI’s actual investment decisions are based on our proprietary models. The conclusions based on the study in this letter may or may not be consistent with JLFMI’s actual investment posture at any given time. Additionally, the commentary provided here is for informational purposes only and should not be taken as a recommendation to invest in any specific securities or according to any specific methodologies. Proper due diligence should be performed before investing in any investment vehicle. There is a risk of loss involved in all investments.