
Bad Breadth
Monday’s market breadth was historically poor given the performance in the major averages.
Like a breath mint for halitosis, sometimes the performance in the popular, cap-weighted stock averages can mask underlying weakness in the overall market breadth (i.e., advancing vs. declining stocks). As such, market conditions may not be quite as robust as the indices would suggest. Monday’s action was a good example of that as market breadth was historically poor given the performance of the large-cap indices. To wit:
On Monday, the cap-weighted large-cap S&P 500 (SPX) gained 0.84%. Despite that solid gain, the broad NYSE Composite actually closed slightly down on the day as there were more declining issues than advancers on the exchange. In the 55 years of data in our database, that is just the 4th time — and the first in 40 years — that the SPX has gained that much on a day that the NYSE was down.
Relaxing the parameters a bit, we dove a little deeper into the data and identified all days during that period that saw the SPX gain at least 0.55%, while within 12% of a 52-week high, when the NYSE closed down on the day. This chart shows all 9 such days in the past 55 years.
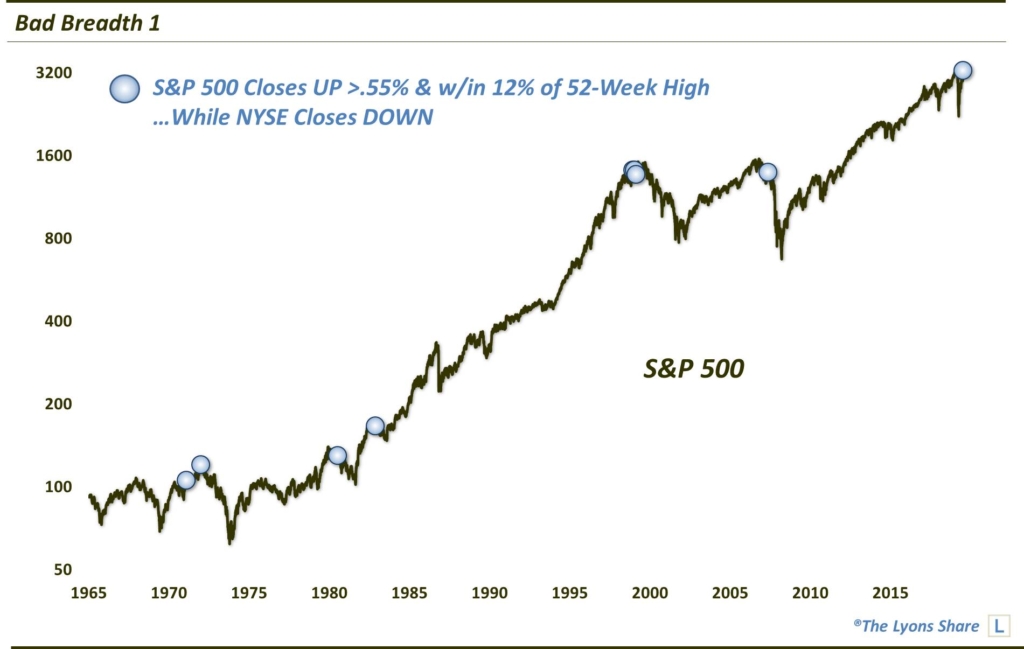
As you can see, several of the previous incidents occurred at quite inauspicious times in the market — including near cyclical peaks in 1973, 1980, 2000 and 2008. History does not have to repeat, but these are not exactly optimistic precedents.
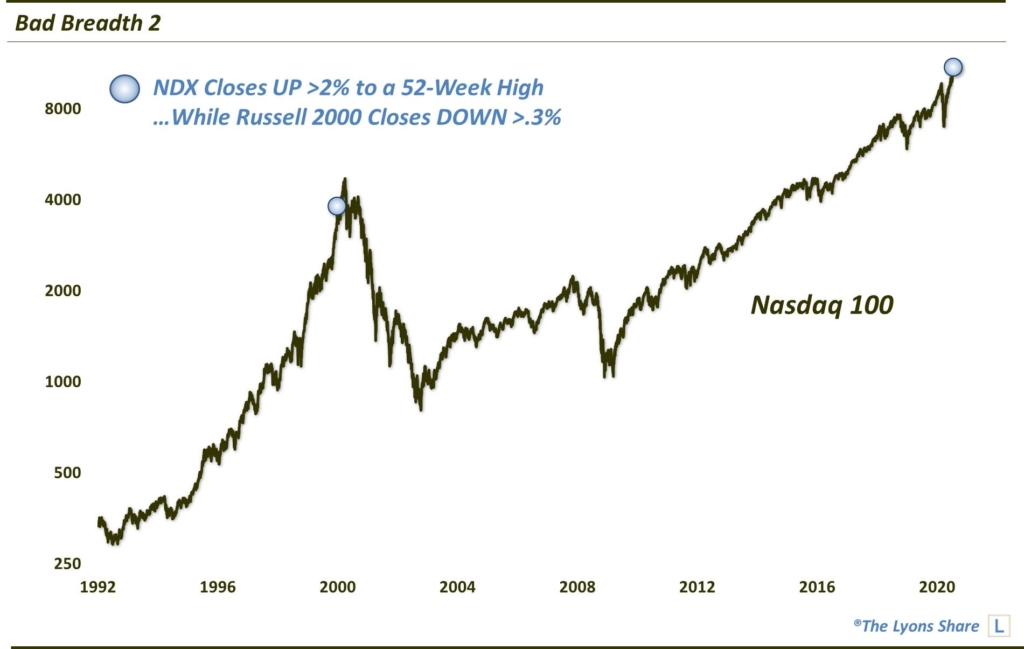
Another example of the disparity between the performance of the popular large-cap averages and those broader indices on Monday can be seen in a comparison between the large-cap Nasdaq 100 (NDX) and the Russell 2000 (RUT) small-cap index. Specifically, the NDX closed up nearly 3% on Monday to a new all-time high. On the flip side, the RUT actually closed down on the day by 0.36%. The only other date in our 30 years of data on the 2 indices that saw this combination of behavior was the 1st day of the millennium (also not a great time to be buying stocks).
So, what is the takeaway here? Is the stock market doomed? Well, we wouldn’t put a ton of stock into a 1-day phenomenon, despite the ominous precedents. There are certainly more important factors that go into our investment decision-making process, namely our objective, quantitative models. However, this is another among a growing collection of red flags — and it will definitely garner more attention from us should this pattern of “bad breadth” continue.
How much “stock” are we putting into this data point? How is it impacting out investment posture? If you’re interested in an “all-access” pass to all of our charts, research — and investment moves — please check out our site, The Lyons Share. You can follow our investment process and posture every day — including insights into what we’re looking to buy and sell and when. Thanks for reading!
_____________
Disclaimer: JLFMI’s actual investment decisions are based on our proprietary models. The conclusions based on the study in this letter may or may not be consistent with JLFMI’s actual investment posture at any given time. Additionally, the commentary provided here is for informational purposes only and should not be taken as a recommendation to invest in any specific securities or according to any specific methodologies. Proper due diligence should be performed before investing in any investment vehicle. There is a risk of loss involved in all investments.


1 Comment