
More Bad Breadth
We are continuing to see more rallies on bad breadth, a disturbing trend.
A few weeks ago, we noted that despite large rallies in the major averages, daily breadth readings were historically weak. The issue is that it is healthier and more supportive of the persistence of a rally when there is broad participation from the universe of stocks. And while this was, at the time, merely a 1-day phenomenon, we noted that “it will definitely garner more attention from us should this pattern of “bad breadth” continue.” Well, despite another solid up day in the major averages, the bad breadth did continue last Friday. Consider that…
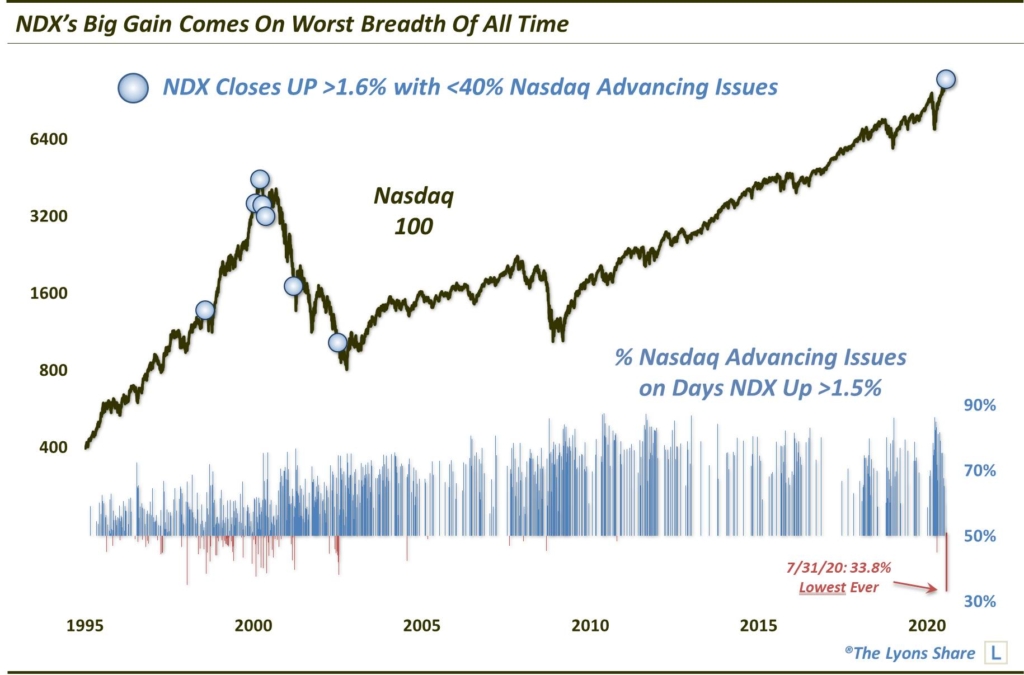
Although the Nasdaq 100 (NDX) jumped about 1.8% on Friday, advancing issues accounted for a mere 33.8% of all issues on the Nasdaq exchange. That means that roughly two thirds of all Nasdaq stocks declined on the day, despite the rally in the cap-weighted NDX. Going back to 1990, that is the lowest % of advancers on any day in the history of our database when the NDX gained at least 1.50%. This chart illustrates that — and marks all 8 days, historically, that saw the NDX up at least 1.60% with 40% or fewer Nasdaq advancing issues. Each of those dates saw the NDX down at least 12% at some point over the next 6 months — with several 2000 events obviously preceding significant long-term damage.
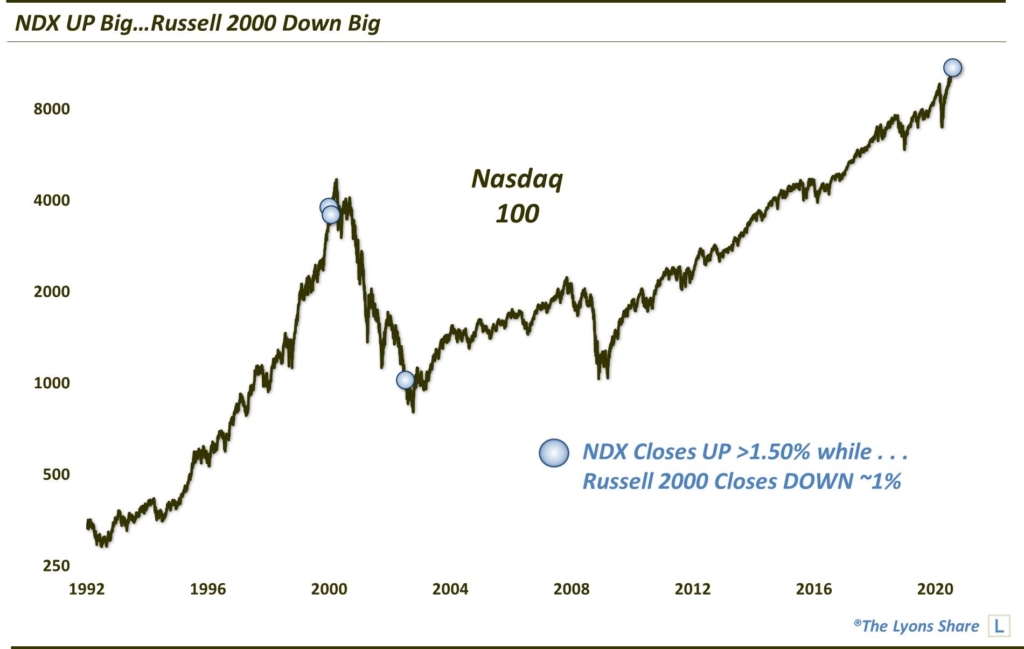
Another manifestation of Friday’s severely large-cap concentrated rally can be seen in a comparison between the NDX and the small-cap Russell 2000 index (RUT). While the NDX was again up about 1.8%, the small-cap RUT was sharply lower — by almost 1% (-0.981%). If we round the loss to -1%, it marks just the 4th day ever seeing that big of a RUT loss when the NDX gained at least 1.50%. The others led to a long-term bear market (2000) or at least an intermediate-term correction prior to a significant low (2002).
In the last “bad breadth” post, we mentioned that we would not put a whole lot of stock into a 1-day phenomenon. However, as we see more and more examples of these days, our concern level over the fate of the current rally is continuing to grow.
How much “stock” are we putting into this data point? How is it impacting out investment posture? If you’re interested in an “all-access” pass to all of our charts, research — and investment moves — please check out our site, The Lyons Share. You can follow our investment process and posture every day — including insights into what we’re looking to buy and sell and when. Thanks for reading!
_____________
Disclaimer: JLFMI’s actual investment decisions are based on our proprietary models. The conclusions based on the study in this letter may or may not be consistent with JLFMI’s actual investment posture at any given time. Additionally, the commentary provided here is for informational purposes only and should not be taken as a recommendation to invest in any specific securities or according to any specific methodologies. Proper due diligence should be performed before investing in any investment vehicle. There is a risk of loss involved in all investments.


