ChOTD-5/19/14 Relative Spike in Nasdaq Volatility Index ($VXN) A Warning?
A week ago, our 5/12 ChOTD illustrated the Nasdaq Composite’s relative increase in volatility vs. the NYSE, as measured by the “average true range” of the indices. Today’s ChOTD provides more evidence of the increase in volatility among that higher-risk segment of the market. The chart shows the ratio between the Nasdaq Volatility Index (VXN) vs. that of the S&P 500 (VIX).
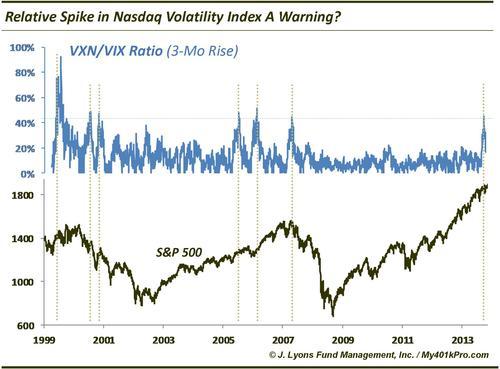
As shown, the VXN:VIX ratio recently jumped by over 40% in a 3-month period. Since 1999, this has proven to be a warning sign for the broad market, albeit advance warning at times. The ratio spiked to that level in late 1999/early 2000, spring 2001, early-mid 2006 and October 2007. Each of these spikes preceded serious damage to the market although the market continued higher for another year+ following the 2006 readings.
This is another example of the volatility increase in riskier stocks, a condition that we consider to be a warning shot to the market, at a minimum.

