ChOTD-5/20/14 Nasdaq Volume: Heavy Skew on Down Days vs Up Days Has Been Warning Since ’07
On April 28, we looked at various trends developing pertaining to Nasdaq volume. First, it has increased considerably in 2014 and second, it has been greatly skewed to the downside, moreso than any year in history. Today, we look at the skew on a shorter-term time frame, specifically 3 months, in search of more actionable indications.
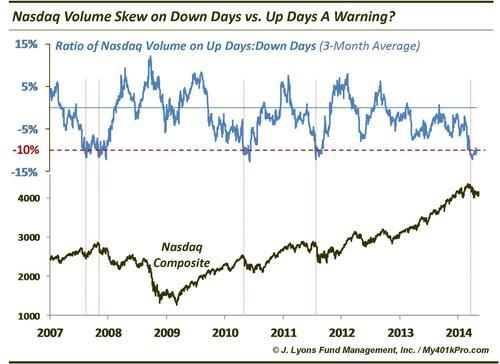
As the chart reveals, the recent 3-month skew is around -10% (i.e., the average Nasdaq volume has been 10% higher on down days vs. up days over the past 30 days). Since 2007, the -10% level has roughly been the lower bound in this indicator. From eye-balling, one can tell that the forays into that area coincided with declines in 2007, 2010 and 2011. And while the Nasdaq did tend to bottom after the volume skew reached those levels, it was not without some intermediate-term pain first. The Nasdaq suffered 3-month drawdowns of -20%, -14% and -11% on a closing basis at some point after reaching the -10% up:down volume threshold in those years. Thus far, after first reaching that level on April 7, the max drawdown in the Nasdaq has been just 4.4%. Recent history suggests a greater decline is in store before the skew and the market recover.


