ChOTD-5/28/14 S&P 500 vs. U.S. Core CapEx
We’re taking a break today from the seemingly endless examples of financial market anomalies and divergences…well, almost. Today’s ChOTD delves into the corporate finance realm but still finds somewhat of a divergence from the norm.
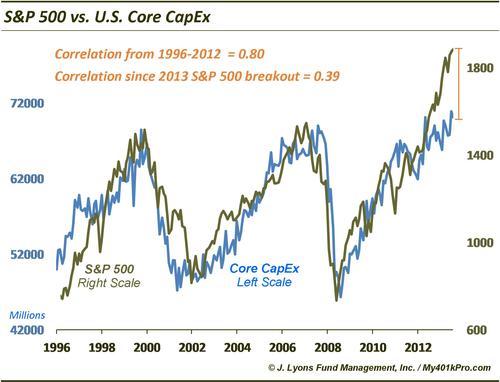
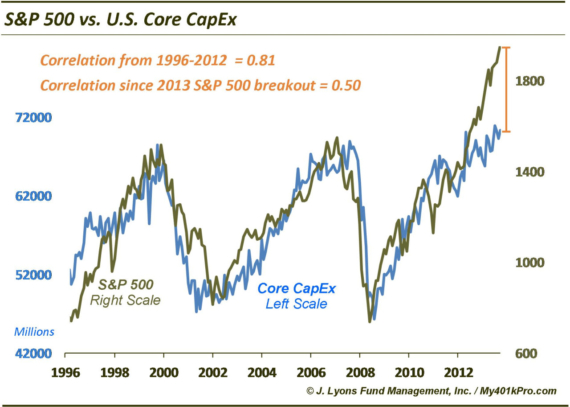
This chart shows the price relationship between stocks (S&P 500) and U.S. Corporate Core Capital Expenditures, or Core CapEx (the official series from the Census Bureau is called “Manufacturers’ New Orders: Nondefense Capital Goods Excluding Aircraft”). As one can see, the slope of Core CapEx has followed the slope of the stock market very closely. This makes intuitive sense, given that the level of economic growth tends to drive the stock market – or is it that the market discounts future growth and influences corporate spending habits? Whether it’s the chicken or the egg, the relationship has been quite apparent. Specifically the two series produced a correlation coefificient of 0.80 from 1996 through 2012.
In May of last year, something changed. The stock market broke out above its 2000 and 2007 peaks to new highs and hasn’t looked back since. Meanwhile, Core CapEx has gone nowhere, literally, for the past 15 months. The current reading from April is within .001% of the January 2013 level. We’ll let the econ pundits speculate as to why this relationship has broken down. But we’ll leave them with a few questions to ponder:
1) To what extent have stock buybacks taken cut into CapEx?
2) What happens to balance sheets in a real stock correction given the buybacks?
3) With profits and margins at peaks (maybe), what happens when companies are forced to spend again on CapEx?
4) If 2 and 3 occur, what sort of EPS theatrics will companies resort to in order to meet estimates?