Gap Widening Between Stocks & CapEx

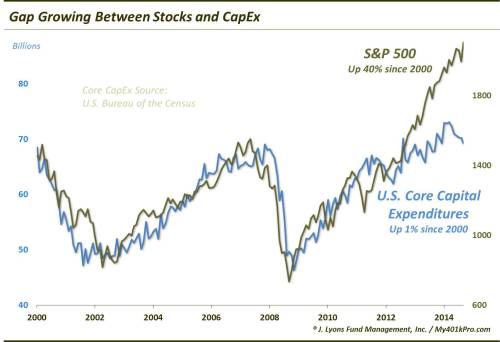
Reluctantly, we wade into the economic arena with today’s Chart Of The Day. We have discussed the topic of corporate core capital expenditures (CapEx) on several occasions. These outlays are important for the upkeep and advancement of companies’ operations. We have noted over the past few years that the growth (or lack thereof) in CapEx has been noticeably lagging behind other economic metrics. This includes the performance of the stock market which has far outpaced CapEx since breaking out 2 years ago. And based on data released this week, that gap grew wider in February.
The Commerce Department released its look at February business spending on Wednesday, revealing a drop of -1.4% in Core Capex (formally, “Manufacturers’ New Orders: Nondefense Capital Goods Excluding Aircraft”). Meanwhile, the S&P 500 closed the month up 5.5% at a record high. And while the two series do not necessarily have to move in tandem (indeed, we have pointed out the disconnect between economic data and the financial markets on many occasion), it makes sense that they would generally move together over the course of a business cycle. And this has been the case since CapEx data began being reported in 1992.
It was particularly true from 1996 to 2012 as the correlation coefficient between Core CapEx and stocks was .81. The two series made proximate cyclical highs in 2000 and 2007 and lows in 2002 and 2009. That relationship broke 2 years ago, however, with the breakout in the S&P 500, which has risen some 40% above its previous highs. CapEx has failed to join stocks in such a breakout, however. In fact, Core CapEx is a mere 1% higher than it was at the peak in 2000. Now, as of February, the divergence between Core CapEx and stocks is the widest it has been during that time.

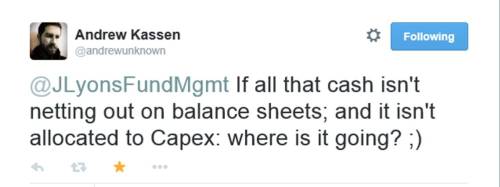
Now, we are not economists (thankfully). So maybe there is a completely sound reason for the suddenly large gap between stocks and CapEx. After observing the behavior of the data for several years, however, it has simply raised our antennae. It also raised the antennae of our Twitter stream who not surprisingly anticipated the corollary to this data gap – and did so coyly and humorously.


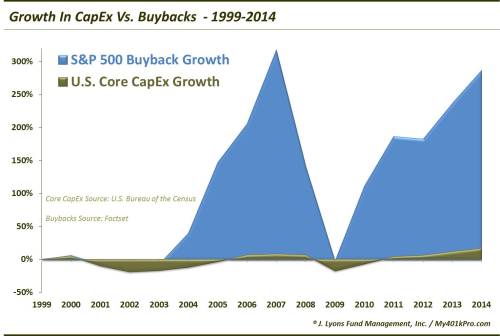
In the conundrum over the gap between CapEx and stocks, buybacks are squarely in the cross hairs. Now it is unknown, and perhaps unknowable, if companies are putting off CapEx in favor of buybacks. However, we do know that buyback activity has been at or near historic levels recently. Consider the growth of buybacks since 1999 versus that of CapEx.

Now there of course is not a perfect relationship between CapEx and buybacks. However, given the recent levels of corporate stock buybacks, it is not a stretch to think that some CapEx may be getting put on the back burner in favor of buybacks, or any number of financial engineering mechanics given the favorable environment for that stuff. Consider this: if the growth of CapEx had kept pace with the S&P 500′s rise over the past 2 years, it would equate to about $24 billion more in CapEx per month. Buybacks are currently running at about $12 billion more per month than 2 years ago. So that’s half the difference there.
Now, once again we are not economists. Perhaps our readers have some good explanations for what is going on here – or perhaps would vouch for our thesis. Otherwise, we will simply leave you with some open-ended questions that we have posed before. We won’t endeavor to answer them – and frankly would be more than a little concerned to hear what they are.
- To what extent have stock buybacks cut into CapEx?
- What happens to balance sheets in a real stock correction given the level of buybacks?
- With profits and margins recently at peaks (maybe), what happens when companies are forced to spend again on CapEx?
- If 2 and 3 occur, what sort of EPS theatrics will companies resort to in order to meet estimates?
__________
“Grand Canyon” photo by Casey Reynolds.
More from Dana Lyons, JLFMI and My401kPro.
The commentary included in this blog is provided for informational purposes only. It does not constitute a recommendation to invest in any specific investment product or service. Proper due diligence should be performed before investing in any investment vehicle. There is a risk of loss involved in all investments.


