ChOTD-6/12/14 VIX:10-Yr Yield: Rate-Adjusted VIX @ At Extreme Low (Post-2007)
Today’s ChOTD is an interesting indicator we recently created. Given the hoopla surrounding the move by the $VIX to new cycle lows, we thought it would be interesting to view it through the prism of the recent low-rate environment by dividing it by the 10-Year Treasury Yield ($TNX). While we don’t subscribe to the belief that low interest rates necessarily change the rules and fundamentals of the entire economic machine, there is no doubting that they do have a significant impact. So we wondered, what effect do the low rates have on the VIX? What level of VIX complacency is low enough to be considered extreme in a complacent low-rate environment? As it turns out, we are at that level of complacent complacency now.
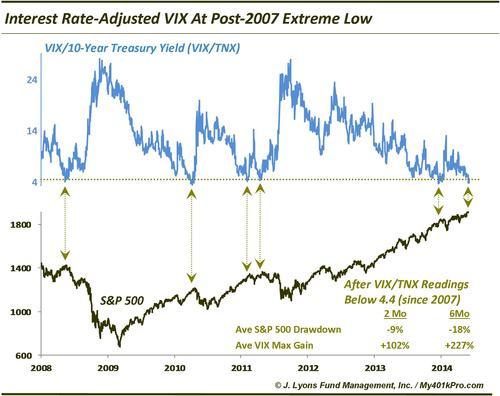
While this VIX:TNX ratio traded below 4 for much of the 1990’s and mid-2000’s, since 2008, it has consistently bottomed just below the 4.4 level, where it currently stands. As shown in the chart, it also hit that level in May 2008, April 2010, February and April 2011 and December 2013. After those instances, the VIX showed an average maximum gain of +102% over the next 2 months and +227% over the next 6 months. Meanwhile, the S&P 500 had average drawdowns of -9% in the subsequent 2 months and -18% in the subsequent 6 months. Time will tell if that action repeats after the current reading. However, based on this indicator over the past 6+ years, the VIX is currently at an extreme low, even when accounting for low interest rates.