ChOTD-6/23/14 Nasdaq Volatility Index $VXN: 2nd Lowest Close Of All-Time
Today’s ChOTD continues what has become a redundant theme of “low volatility” charts. We’d like to say this will be the last volatility-related post, but it probably won’t be. The nature of low-volatility environments is that they lull investors to sleep – then, boom! It is the same with reporting on the topic. After awhile, it kind of gets monotonous. However, we’d recommend investors steel themselves from being anesthetized to the present low volatility conditions because they truly are historic. Today’s low-vol example is the Nasdaq 100 Volatility Index, $VXN.
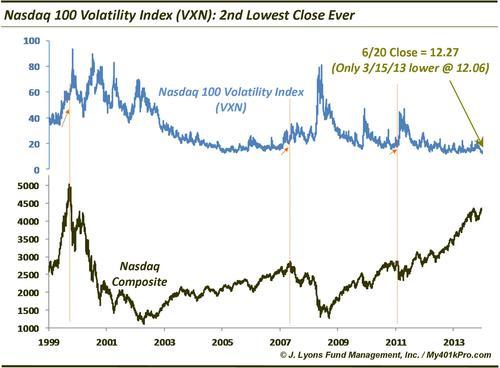
The $VXN closed Friday at the 2nd lowest level ever, 12.27. Only March 15, 2013 saw a lower close of 12.06. While low volatility periods can persist for some time as equities grind higher, volatility readings this absolutely low do not. So, rather than trying an aggressively bearish play against equities to take advantage, the more prudent play is probably to play the volatility instruments themselves, from a bullish perspective. Furthermore, looking at the last three intermediate to long-term Nasdaq corrections starting in 2000, 2007 and 2011 (orange dotted lines), the $VXN actually formed higher lows before the final top in stocks.


