ChOTD-6/27/14 Nasdaq 1st Half 2014 Volume: A Tale Of 2 Quarters
It was the best of volume, it was the worst of volume. On April 28, we noted that, contrary to popular thought, Nasdaq volume to start the year was actually the highest since 2010. Little did we know, a shift had already begun…back to popular thought. Our ChOTD reveals this 1st half Nasdaq volume dichotomy.
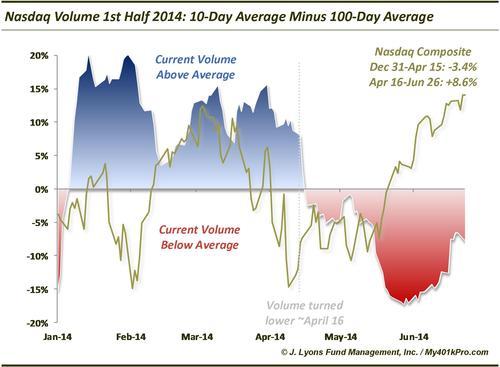
We measured the relative level of current volume by subtracting the average 100-day Nasdaq volume from the 10-day average. As the chart shows, volume was above average (by as much as 20%) until the middle of April. Since then, volume has been below average, by as much as 17%.
What happened to spark this sudden change? Interestingly, it occurred right near tax day. While this may be a catalyst, we have no idea why. The other obvious change is the performance of the market during the two periods. Up to April 15, essentially the YTD low, the Nasdaq was down 3.4% for the year. Since then, the Nasdaq is up 8.6%.
We realize that price is truth and that the market has been rallying on declining volume since 2009. However, on a micro-level, the stark change in volume trend is at least interesting, given that it took place concurrent with the direction change in the market. At a minimum, it would be more comforting for bulls if the volume was trending in their favor.


