ChOTD-6/4/14 Why The Recent Highs *LOOK* Like A Fitting Top: S&P 400 Midcap Edition
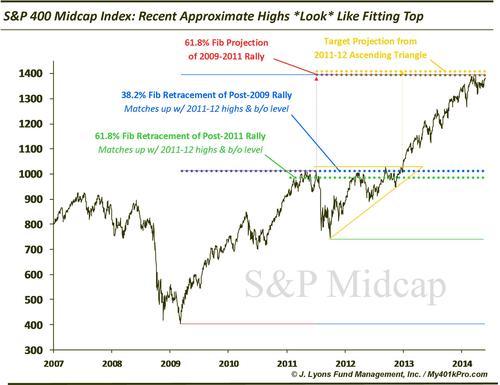
Notice how the recent S&P 400 high occurred at an area in close proximity to key levels according to two separate analyses:
-
61.8% Fibonacci Projection of the 2009-2011 rally
-
Measured Target Projection of the 2011-2012 ascending triangle
Additionally, like we did with the Russell 2000 and the Dow, by projecting where key future Fibonacci support levels would be based on recent highs we can, in a way, reverse-engineer a top. For example, given the level of the recent high in the S&P 400, future key retracement support sits at an important level:
-
38.2% Fibonacci Retracement of the post-2009 rally roughly lines up with the 2011-12 highs and 2013 breakout level
-
61.8% Fibonacci Retracement of the post-2011 rally roughly lines up with the 2011-12 highs and 2013 breakout level
To reiterate, we are not calling a top, though if one developed here it would not surprise us . We are merely pointing out, as with the Russell 2000 and the Dow, the fact that several key levels lie near the recent highs or are positioned at key levels based off of recent highs in the S&P 400.