Nasdaq 100: Narrowest 52-Week High In History
There have been no shortage of complaints surrounding the participation, reasons and quality of the recent leg of the cyclical equity rally. We wouldn’t go so far as to say it’s the “most hated” rally in history given the fact that equity allocations among various investor groups are closer to historical highs than levels indicating apathy. Nor would we take exception to the “reason” (i.e., Fed intervention) behind the rally. Frankly, we have no idea why stocks are rallying. And to be completely honest, neither we nor anyone else ever really knows the “reasons” behind any rally. All we know, and all we care about, is that stocks are rallying.
We do, however, feel analysis into the quality of a rally is legitimate. The behavior of breadth in terms of advance/decline issues and volume as well as new highs/lows can give clues as to the sustainability of an advance. At the very least, this can be important when considering whether or not to commit a significant amount of longer-term capital into stocks. For example, when the broad equity indices are making new highs with fewer relative advancing stocks and new individual stock highs (i.e., divergences), the rally’s days could be numbered.
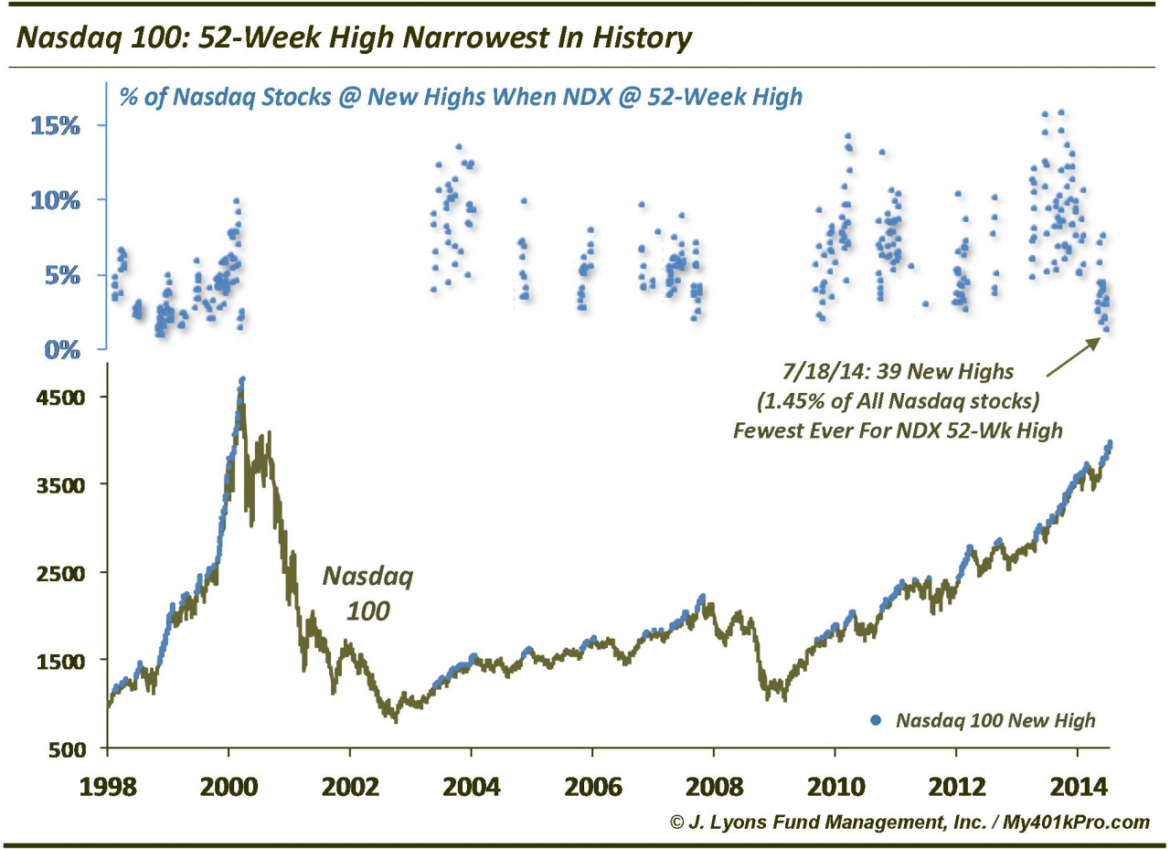
While such divergences in “quality” can last for awhile, at a certain point they reach an extreme and threaten the rally. The Nasdaq 100 has reached that point. While the $NDX is at a 52-week high, the quality of the new high has never been more narrow, at least when measured by the total number of Nasdaq stocks also at new highs. The $NDX new high on July 18 was accompanied by just 39 total Nasdaq new highs. That is the lowest number in the history of the Nasdaq 100 (back to 1990). On a % basis, only a handful of days from late 1998 saw a smaller number than the 1.45% of total Nasdaq stocks at new highs on July 18. The $NDX then was coming off of a significant correction and was in the early stages of the epic breadth divergence that persisted until the mega-cap tech stock bubble burst in 2000.
There have been only 3 other readings in history that even approach the current one. One came in the fall of 2009 while the Nasdaq 100 was emerging from the cyclical market low. The other two occurred in March 2000 and September 2007 immediately preceding the past two cyclical tops. This is a genuine concern regarding the sustainability of this rally.


