ChOTD-7/2/14 The Most Significant Chart Event Of This Era?
If we told you that a major broad U.S. equity index was in formation to potentially form a triple top spanning three decades, would you believe it? Well, it is an actuality and is the subject of today’s hyperbolic ChOTD:
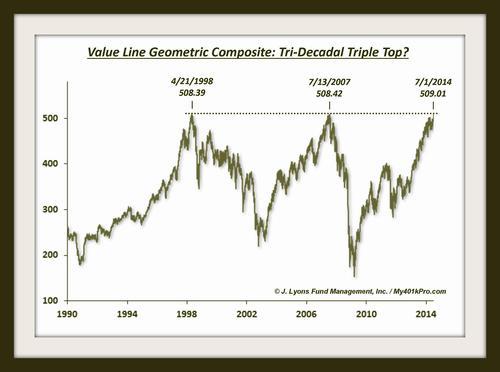
The index is the Value Line Geometric Composite. Many investors, particularly millennials and other young bucks, may have never even heard of this index but it is a favorite of some of the old-timers in the industry. One reason for the popularity among the old guard is that it encompasses a large swathe of the U.S. equity market and has been in existence since 1961. Therefore it was available as a viable representation of the broad stock market, including small caps, before other broad indices like the Wilshire or obviously Russell 2000 existed.
So what is it? It is an unweighted average made up of approximately 1600-1800 stocks. The “Geometric” portion of its name comes from the fact that the daily index change is calculated by essentially using the median change of all its constituents. Therefore, it is thought to best represent what the median, or typical, stock in the broad market is doing. Who trades it? As far as we know, there are no longer any instruments or securities traded based off of the Value Line Geometric Composite. Formerly, there was a futures contract based on it traded on the Kansas City Board of Trade (I believe it was the first equity index in the futures market).
Back to the chart. So if nobody trades off of it, what good is the chart, specifically the levels on the chart? It’s a good question. Is there a greater force that “guides” markets such that they move in a historically self-relevant manner with identifiable patterns (at least after the fact)? Or are market levels and patterns significant (to the extent that they are) only due to the self-fulfilling expectations and actions of traders and their emotional responses to the various price levels? Certainly the latter is true to an extent, but what about the former? We can’t know for sure, but we can’t dismiss the possibility entirely, if only because of two data points on the chart. The top in the Value Line Geometric Composite in 1998 occurred at 508.39. The top in 2007 was 508.42. It is possible that this was just random. However, let’s also consider the possibility that it wasn’t random considering the tops occurred within 0.006% of each other 2,316 days apart.
Realistically, what are the odds that the Value Line Geometric Composite forms a triple top here? Considering the current momentum in the market and the fact that prices have continued to steamroll any and every concern of historical significance, the odds don’t seem very good. In fact the index could bust out 2% above this level today and render the title of the chart extremely ridiculous (which it probably is already). However, on the 0.006% chance that a triple top spanning 3 decades does form here and now, we had to post this chart today.