Key Market Gauge Able To Hold Important Support

Just 8 days ago, we highlighted the breakdown of the Value Line Geometric Composite below its post-2009 UP trendline. And while trendlines are a dime a dozen, we viewed this one as important. So much so, in fact, that we labeled it “the most important line in the equity market”. We were not trying to sensationalize either. See, the Value Line Composite is an unweighted index of approximately 1700 stocks. Therefore, in our view, it is the best barometer of the overall stock market.
Well, you might say that the subsequent and immediate pseudo-crash was somewhat validating of our stance. However, this post is not a victory lap, nor are we piling on. In fact, it’s just the opposite. While the break of the trendline, in our view, has major longer-term implications (not to mention its crashy short-term implications), the behavior of the index this week does offer some fodder for the bulls. And it goes beyond just the fact that the index rebounded strongly during the latter half of the week.
It also has a lot to do with where it rebounded.
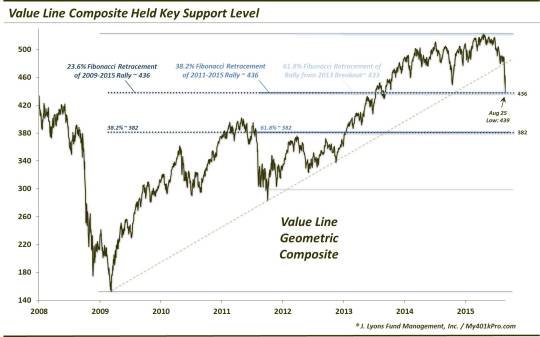
The Value Line Geometric Composite held an important support level as identified in the chart. The mid-430′s marked a confluence of Fibonacci Retracement levels drawn from the important lows since 2009 to the April high. Specifically, we find these 3 levels all within close proximity:
- The 23.6% Fibonacci Retracement of the 2009-2015 Rally ~436
- The 38.2% Fibonacci Retracement of the 2011-2015 Rally ~436
- The 61.8% Fibonacci Retracement of the Rally from the 2013 Breakout Point to the April High ~433
We have mentioned before that we have increased confidence in the validity of a chart level when multiple analyses line up nearby there. That is certainly the case here. Furthermore, our confidence is heightened when the level is tested – and it holds – as the Value Line Composite did here, bottoming at 439 on August 25. That validates the level as important as prices have shown they “respect” the level.
So one piece of good news for the bulls is that the index stopped going down. Another piece of good news is that is stopped going down where it *should have*. The point is that even in the midst of the seemingly out-of-control downward spiral in prices over the past week, stocks still conformed to a methodical, step-by-step pathway. They just happened to skip a few steps. (FYI, it is also comforting that many indices around the globe also stopped dropping at key levels, though many too suffered longer-term damage).
This gives us confidence that we can continue to navigate this market in a manageable, systematic manner as opposed to facing significant risk that prices were succumbing to a 1987-type crash. It also presents us with a line in the sand, should the index eventually go on to “test” the 430′s level (a development that would not at all surprise us). We have a reference point to generally orient us bullishly should the level hold or quickly recover a break – and bearishly should the level fail. A break, incidentally would open up about 13% more downside.
It was an epic week in the stock market. We witnessed a historic washout on Monday with all matters on global indices suffering major breakdowns – and then an epic reversal to end the week. So there was enough good and bad news for bulls and bears to chew on this weekend.
So enjoy the weekend – you earned it.
______
“Tiger” photo by johnlund.com.
More from Dana Lyons, JLFMI and My401kPro.
The commentary included in this blog is provided for informational purposes only. It does not constitute a recommendation to invest in any specific investment product or service. Proper due diligence should be performed before investing in any investment vehicle. There is a risk of loss involved in all investments.


