ChOTD-7/8/14 CBOE SKEW Index 1990-2014: Tail Risk Indicator Has Had 7 Readings Above 140, 3 In Past 10 Days
We’ve posted about the CBOE SKEW Index a few times. To reiterate, it is an options-derived measure of market tail risk, i.e., risk of an outlier, black swan event (more SKEW specifics at CBOE). On June 26, we noted that when measured relative to the $VIX, SKEW was at a level reached only 2 other times in its history (since 1990). Today’s ChOTD looks at the raw SKEW value.
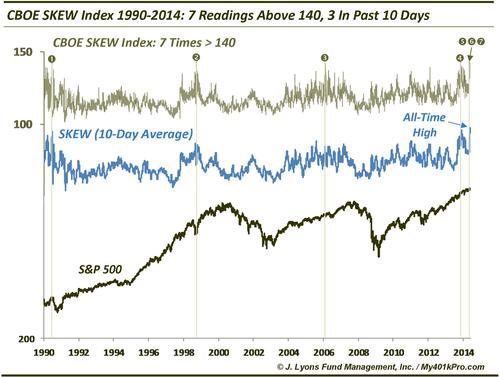
Here, one can see that since 1990, the SKEW Index has only risen above the 140 level (i.e., elevated tail risk) on 7 occasions. Four of them occurred in June 1990, October 1998, March 2006 and January 2014. The other three occurred in the last 10 days.
While supposedly a tail risk warning, the indicator has had mixed results. In 1990 and 2006, the readings preceded market corrections by about 6 weeks, with the 1990 example being quite a serious one. The occurrence this past January preceded a minor pullback by a few days. The 1998 reading occurred at the bottom of a serious correction. So, while it has been somewhat timely, on occasion, it has hardly been a reliable precursor to black swan events.
The current cluster of readings is unprecedented, like so many things we’ve looked at lately. It is difficult to know if one should read much into the significance of this event considering a) its unprecedented condition and b) its mixed historical record. Our instinct tells us that this anomaly is not a healthy sign for the market and will result in considerable weakness…eventually, However, like so many of these anomalous events of late, the ability to accurately time the trouble will likely be extraordinarily difficult, given the uniqueness of the event as well as the fact that the market has, thus far, rolled right over any and all such warnings. Therefore, while some day, we’ll probably look back at these readings and see they were a warning, we have no edge in implementing them into a strategy at this time.