Is Tail Risk Really At An All-Time High?

The CBOE Skew Index hit an all-time high yesterday…but is this “black swan” indicator really something to worry about?
We’ve posted several pieces on the CBOE Skew Index over the past 18 months. This has been due to the indicator’s unprecedented behavior over that time period. To be frank, we really did not intend to write any more posts on the topic any time soon given their likely redundancy. However, we are making the exception today, at the risk of such redundancy, on account of yesterday’s all-time record high reading in the Skew of 148.92.
To refresh, the SKEW is a calculation from S&P 500 out-of-the-money options that measures perceived tail risk, i.e., an outlier event two or more standard deviations below the mean. Essentially, it measures options traders’ perceived risk of a major decline (more at CBOE.com).
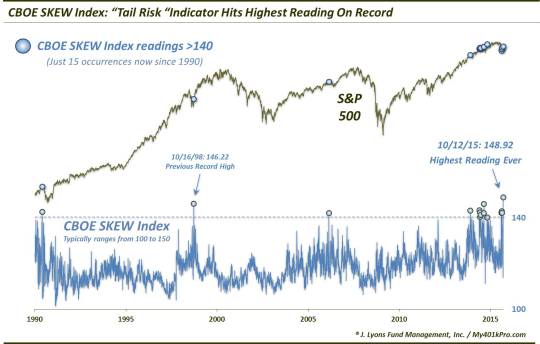
Typically, the SKEW ranges from 100 to 150. Readings close to 100 indicate that the perceived probability of an outlier return is negligible whereas readings approaching 150 suggest the probability is significant. Obviously, at 148.92, yesterday’s Skew reading is more than “approaching” 150, it’s nearly on top of it. By definition, the options market is pricing in the greatest risk of an outlier event in the history of the series. But should we really be that concerned?
For starters,
while the Skew is unquestionably elevated, the fact that it hit an all-time high is a trivial matter when comparing the reading versus other high readings historically. We have used 140 as the line of demarcation for “high” Skew readings. Thus, the fact that it hit 148 instead of, say 145, is of no consequence.
Secondly, we have pointed out the spotty record based on elevated Skew readings before. The index gained cult status after hitting 140 for the first time in June 1990, just weeks before Saddam Hussein’s incursion into Kuwait sent equity markets reeling. Since then, however, high readings have been less than accurate.
In fact, the next reading above 140, which didn’t come until October 1998, actually occurred as the market was emerging from a bear market. Following that reading (which, at 146.22, was the previous record before yesterday), the S&P 500 shot up some 20% over the next 3 months. So, not very black swan-ish.
Speaking of that October 1998 occurrence, we highlighted it in a post a few weeks ago. We noted further evidence of its uniqueness among historical Skew readings above 140 based on the considerable distance of the S&P 500 from its 52-week high and by the elevated level of the VIX at the time. No other high Skew readings were accompanied by such conditions…until a few weeks ago.

This scatter plot shows the unusual nature of the September Skew readings as well as the 1998 reading over 140. As mentioned, the 1998 instance was followed by an explosive rally. Likewise, the S&P 500 has bounced since the September readings, though, with a retest in between. The gains since the two September readings, however, have actually already exceeded the maximum 3-month gains following any of the other elevated Skew readings, historically.
At a minimum, this suggests that very recent elevated Skew readings have not conformed to the circumstances and aftermath of the “conventional” high readings, historically. And while yesterday’s reading was not as “unconventional” as the September 2015 and October 1998 readings, it was still far from the “normal” make-up of such Skew readings. Therefore, there is reason to be skeptical of its tail risk warning status.
Speaking of recent times, the 1st chart above illustrates how many of the historical Skew readings over 140 have occurred within the past 2 years. No fewer than 13 of the 16 historical Skew readings over 140 have occurred since December 2013. A chart we posted near the end of last year serves as a graphic illustration of the unusually high and persistent Skew readings last year especially.
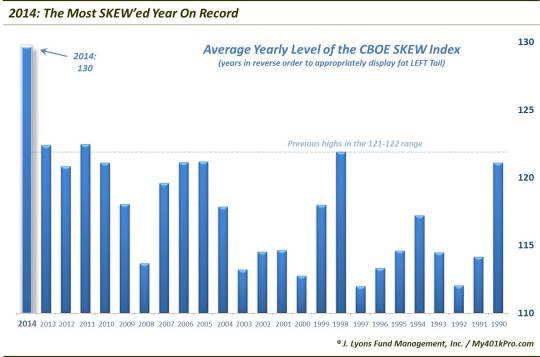
The average level of the Skew last year was far above any other year since the Skew’s inception in 1990. This persistently high Skew for so long, along with the cluster of Skew extremes above 140 might understandably make one skeptical of the indicator’s usefulness as a tail risk warning. That’s because, outside of the October 2014 selloff, there has been precious little in the way of stock declines following these recent high readings. And while there has been limited intermediate-term upside following these readings, there has certainly been no black swan event.
So what’s our ultimate takeaway? I think investors and traders would be far better served focusing on other factors besides a high Skew reading. It isn’t that we think it the indicator is irrelevant or has lost all of its usefulness. We actually think there is something meaningful about the cluster and persistence of high Skew readings over the past few years. After all, this is a real money indicator, not some survey. That is, market participants have real money on the line, generating these readings. The problem is, we just don’t know what the meaning of the Skew’s behavior of the past few years is. Therefore, we don’t know how to worry about it at this point, even though it may ultimately prove to be a valid warning.
Therefore, we choose, and recommend others choose, to worry about something other than the Skew at this point.
____
“_ rare visitor _” photo by Ia_imagen.
More from Dana Lyons, JLFMI and My401kPro.
The commentary included in this blog is provided for informational purposes only. It does not constitute a recommendation to invest in any specific investment product or service. Proper due diligence should be performed before investing in any investment vehicle. There is a risk of loss involved in all investments.


