Margin Debt Cycle: Not Dead Yet?
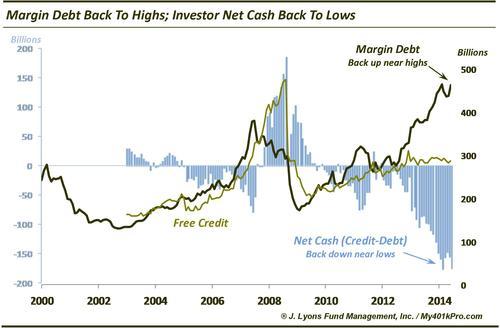
The NYSE released their June margin debt update yesterday and it was a doozy. Margin debt jumped nearly 6% to just 0.3% shy of the February all-time high. That was the largest increase since January 2013. Meanwhile, investor credit rose about 2%. This resulted in a drop in investor net cash of around 13%, the biggest drop since December. Net cash is now back down to just 1% above the February all-time low.

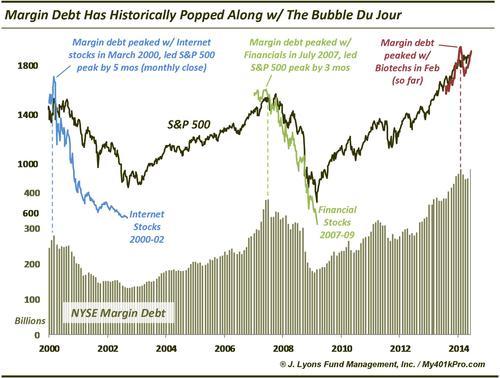
For those arguing the likelihood that February marked the peak in margin debt (us included), this has to at least give pause. However even with margin debt within spitting distance of its all-time high, it isn’t there yet and may not get there. What would prevent it from climbing even just the marginal (no pun intended) amount needed to reach its peak? Let’s revisit a chart we published in a post a few months ago.
In the post, we surmised that margin debt cycles peak along with the bubble or hot sector of the day. This makes sense since those sectors attract the most attention, volume and money flows. So it stands to reason that much of the margin debt at a given time is directed toward the bubble du jour. Thus when that bubble pops, the margin debt cycle peaks as well. This appears to have occurred in the past two cycles ending in 2000 and 2007.

Margin debt peaked in March 2000 when the dot.com bubble popped. Likewise, it peaked in July 2007 when the financial stocks began to roll over. Each of those peaks preceded the cyclical peak in the broader market by 3-5 months. In the current cycle, the margin debt peak (so far) occurred in February. This was the same month that saw the peak in bubbly, or momo, sectors like biotechs and social media stocks. Whether or not February marked the peak in those sectors could be a crucial determinant in the longevity of the cyclical bull market.
Why does it matter? For one, if February was the peak in those sectors, the lead time from the bubble/margin debt peak until the peak in the broad market, as indicated by the previous cycles, would suggest a top is imminent. That is certainly a concern, but the behavior of the current cycle doesn’t necessarily have to follow the prior cycles, especially only 2 precedents.
A bigger concern is one of flows. Why did margin debt bounce back so strongly in June if the bubbly sectors have already topped? Does that throw a wrench into that theoretical relationship? Not necessarily. Consider that biotechs were up over 7% in June and the Global X Social Media ETF (SOCL) was up 10%. Given such a rebound, the jump in margin debt is not necessarily a surprise. These sectors have not fared well in July, however, which probably does not bode well for margin debt figures this month.
A key point now is that these sectors are trading near resistance levels. It could well be make or break time for them and for margin debt – and, due to the record level of margin debt, for the broad market as well. If these sectors are able to break through resistance and embark on a run to new highs, they can continue to attract margin-fueled money flows. This would obviously be bullish for the market as long as the trend continues. However, if the momo sectors are unable to move on to new highs and instead begin to break down again, the “potential” risk of record high margin debt will become “realized” risk. This will result in money flowing out of these areas of the market and, given the record debt levels, out of other areas of the market as well. A margin debt deleveraging cycle from these levels has the potential to substantially exacerbate any market correction.
The reaction by biotechs, social media stocks and other momos from current levels will be key.

