Subdued inverse ETF volume far from fear levels
We’ve pointed out evidence of elevated fear (at least in the short-term) coming from the equity options market over the past few days. Unfortunately for those looking for a bottom to the current selloff, we are seeing scant evidence thus far from other indicators we monitor. One such indicator is the relative level of volume in inverse ETF’s (ETF’s that rise when the market falls). Since we began tracking this data about 3 years ago, it has been the most consistently accurate indicator in pinpointing short to intermediate-term lows in the market (see our posts from the February 4 and April 15 lows).
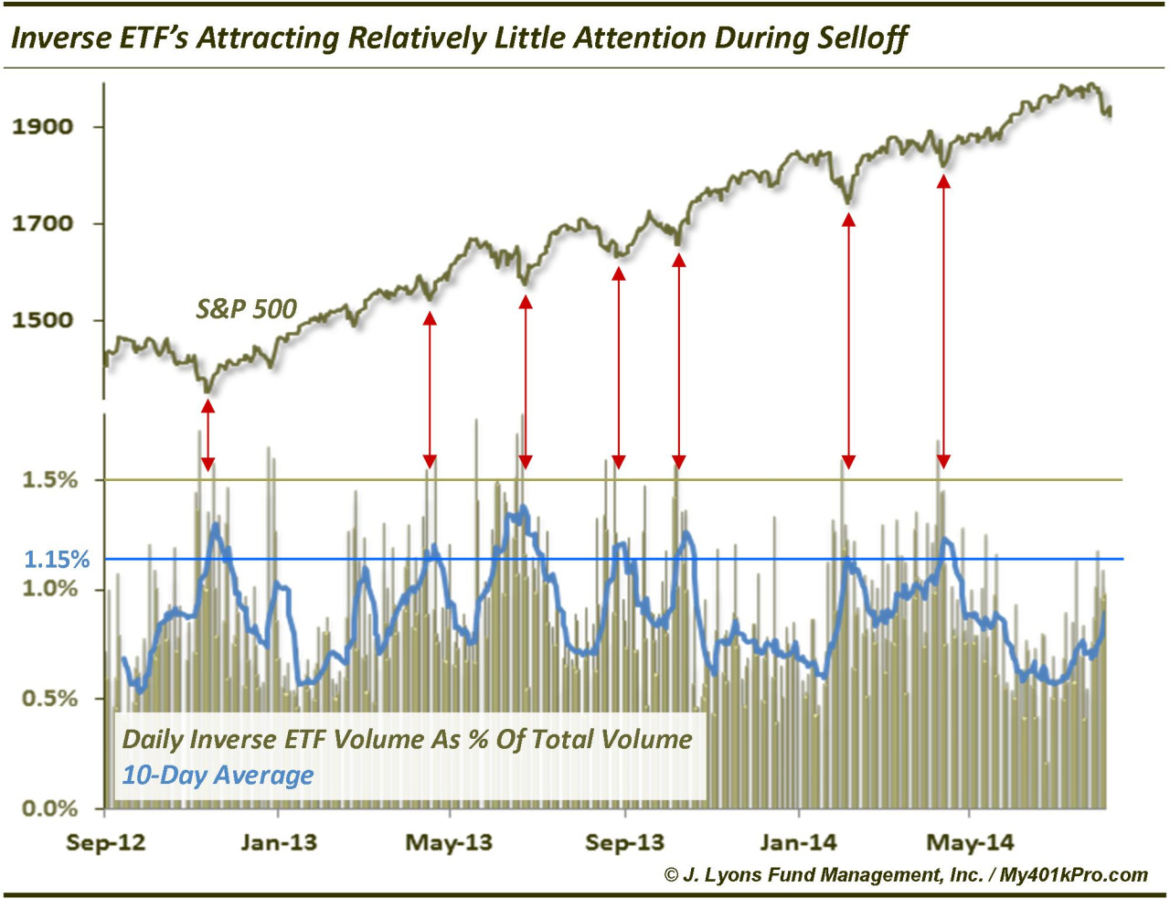
This indicator tracks the relative level of volume traded in inverse ETF’s as a percentage of total volume on the NYSE and Nasdaq. We should point out that this is a proprietary compilation of inverse ETF’s and not inclusive of all such funds. However, it is the same group that we have monitored for years and thus allows for accurate and relevant comparisons.
Not surprisingly, relative inverse ETF volume tends to rise during selloffs, eventually peaking near a low in the market. Since the fall of 2012, each selloff in the stock market has been accompanied by at least one daily reading of 1.5% in relative inverse ETF volume and a rise in its 10-day average to at least 1.15%. While there is no rule that these levels must be attained during a selloff in stocks, they have been unfailingly consistent over the past 2 years.
The issue for bulls, or at least bottom-pickers, in the present situation is that inverse ETF volume has been remarkably subdued thus far in the selloff. The highest daily reading over the past few weeks has been just 1.19% and the 10-day average is only at 0.9%. Perhaps traders have become accustomed to each dip in the market being bought aggressively and are more complacent about a pullback. Whatever the case, we would expect the daily and 10-day average of relative inverse ETF volume to approach the 1.5% and 1.15% levels respectively before the selloff is complete.
This can develop quickly, with even one daily spike below recent support and key moving averages in the major indices as a potential catalyst. We will be monitoring this indicator and provide updates as warranted.