European stocks bounce at precisely the right spot
As it pertains to the recent sell off in stocks, no region got hammered worse than Europe. The damage there was across the board as the PIIGS got slaughtered (see our July 21 warning) along with the core countries like Germany and France. The selling was relentless enough that European stocks, as measured by the MSCI Europe Index, became more oversold on a short-term basis than at any point since the meltdown in August 2011. Selling pressure that severe requires a support level of substantial consequence in order to arrest the decline. The MSCI Europe Index appears to have found such a level, at least for the moment.
Fibonacci numbers represent a mathematical sequence that is commonly found in all walks of life, including nature and financial markets. A stock price, for example, will often display counter-trend moves (or retracements) to its larger trend in increments consistent with the Fibonacci sequence. The most common, and most important, retracement percentages are 61.8%, 38.2% and 23.6%. Therefore, we look at these levels in order to assess possible areas of containment during a counter-trend move.
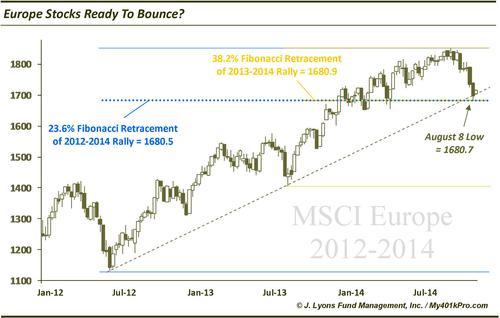
The strongest signals come when multiple Fibonacci Retracement levels measured from separate key inflection points are in alignment with each other. Such is the case with the MSCI Europe. Measured from the major July 2012 low to the recent June high, a 23.6% retracement lies at precisely 1680.5. A 38.2% retracement from the intermediate-term low in June 2013 to the recent June highs equates to almost the exact level at 1680.9. Therefore, the close proximity of the two key Fibonacci retracement levels measured from the two most significant lows of the past several years places great significance on the 1680 level. On August 8, the MSCI Europe Index made an intraday low of 1680.7 before bouncing the past few days.
Now markets are not always so precise that they retrace moves to the exact Fibonacci penny. That the index held the general 1680 level is the important thing, and telling as well. When an index holds a potential support or resistance level, even temporarily, it reinforces the validity of that level as significant. This is true both in that price “respected” the level initially and because it creates a new consequential point of reference on a chart.
Add in the up trendline from the 2012 low and the 1680 level gains even more significance (by the way, the presence of the trendline at this level should not be a surprise since it connects the 2 lows from which our Fibonacci Retracements were measured). Additionally, if we scroll out a little bit farther, we see that the 1680 level takes on even more importance. Specifically, the 61.8% Fibonacci Retracement of the 2007 to 2009 decline comes at – you guessed it, 1679.1.
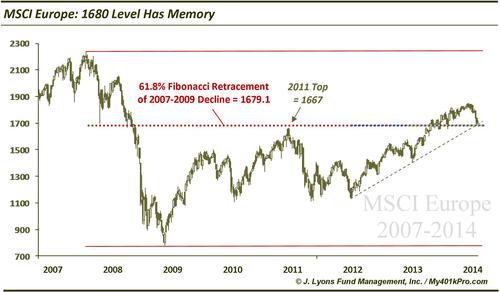
In 2011, the MSCI Europe Index rallied as high as 1667, within 1% of the 61.8% Fibonacci Retracement, before failing. It took over 2 years before the index surpassed the 1679.1 level late last year. Again, that episode adds significance to the 1680 level since it creates an inflection point on the chart (i.e., what was resistance there is now support) and it reinforces the validity of the Fibonacci sequence.
The bottom line is that the 1680 level holds great significance for the MSCI Europe Index. That doesn’t mean that the 1680.7 August 8 low has to hold precisely. A sell off as sharp as that which occurred in Europe over the last month doesn’t typically turn on a dime. Therefore, we’d guess there is at least a 50/50 chance that the 1680 level gets “tested” again and perhaps even slightly penetrated. As long as the general level holds or as long as any drop below is quickly reversed, European stocks could be primed for at least a short to intermediate-term rally (i.e., weeks to months).
More from JLFMI.