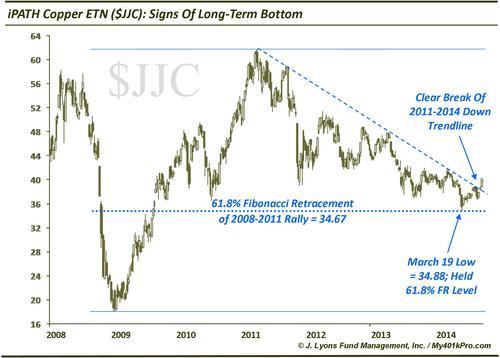
Update: Copper JJC at attractive level within long-term bottoming process
On July 11, we posted a chart noting the initial stages of a potential long-term bottom in the Copper ETN JJC. The key points in its favor were that it A) held the 61.8% Fibonacci Retracement of the 2008-2011 rally and B) had clearly broken above the first major resistance hurdle: the well-defined down trendline from the 2011 top.
Since this potential bottom is a longer-term development, it will take time and most likely exhibit some volatile behavior before it moves higher in earnest. Therefore, investors should be patient in identifying attractive entry points within this bottoming process. One of those entry points may be upon us as JJC has pulled back today to the $38 area.
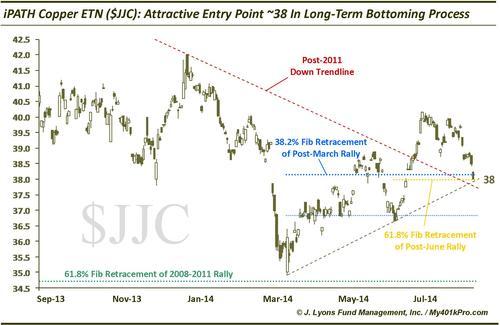
The $38 area represents several layers of potential support, including
- The 61.8% Fibonacci Retracement of the post-June rally
- The 38.2% Fibonacci Retracement of the post-March rally
- The up trendline connecting those March and June lows
- The topside of the post-2011 down trendline that it broke above in June-July
- A large unfilled gap up from June 20 that led to the trendline breakout
Again, this is a longer-term potential bottom so it may require some patience to let it play out. The $38 level would be a good spot for buyers to start coming in, however. Should JJC continue lower straight through the $38 support, the next attractive level would be just under the $37 level. We will post necessary updates should developments warrant them.
More from JLFMI.